In Clayton County↗ET, Black students graduate at 87.1%. White students graduate at 75.7%. The gap runs 11.4 percentage points in Black students' favor, a reversal that demonstrates significant improvement since 2011, when fewer than six in 10 Black students in Georgia earned a diploma on time.
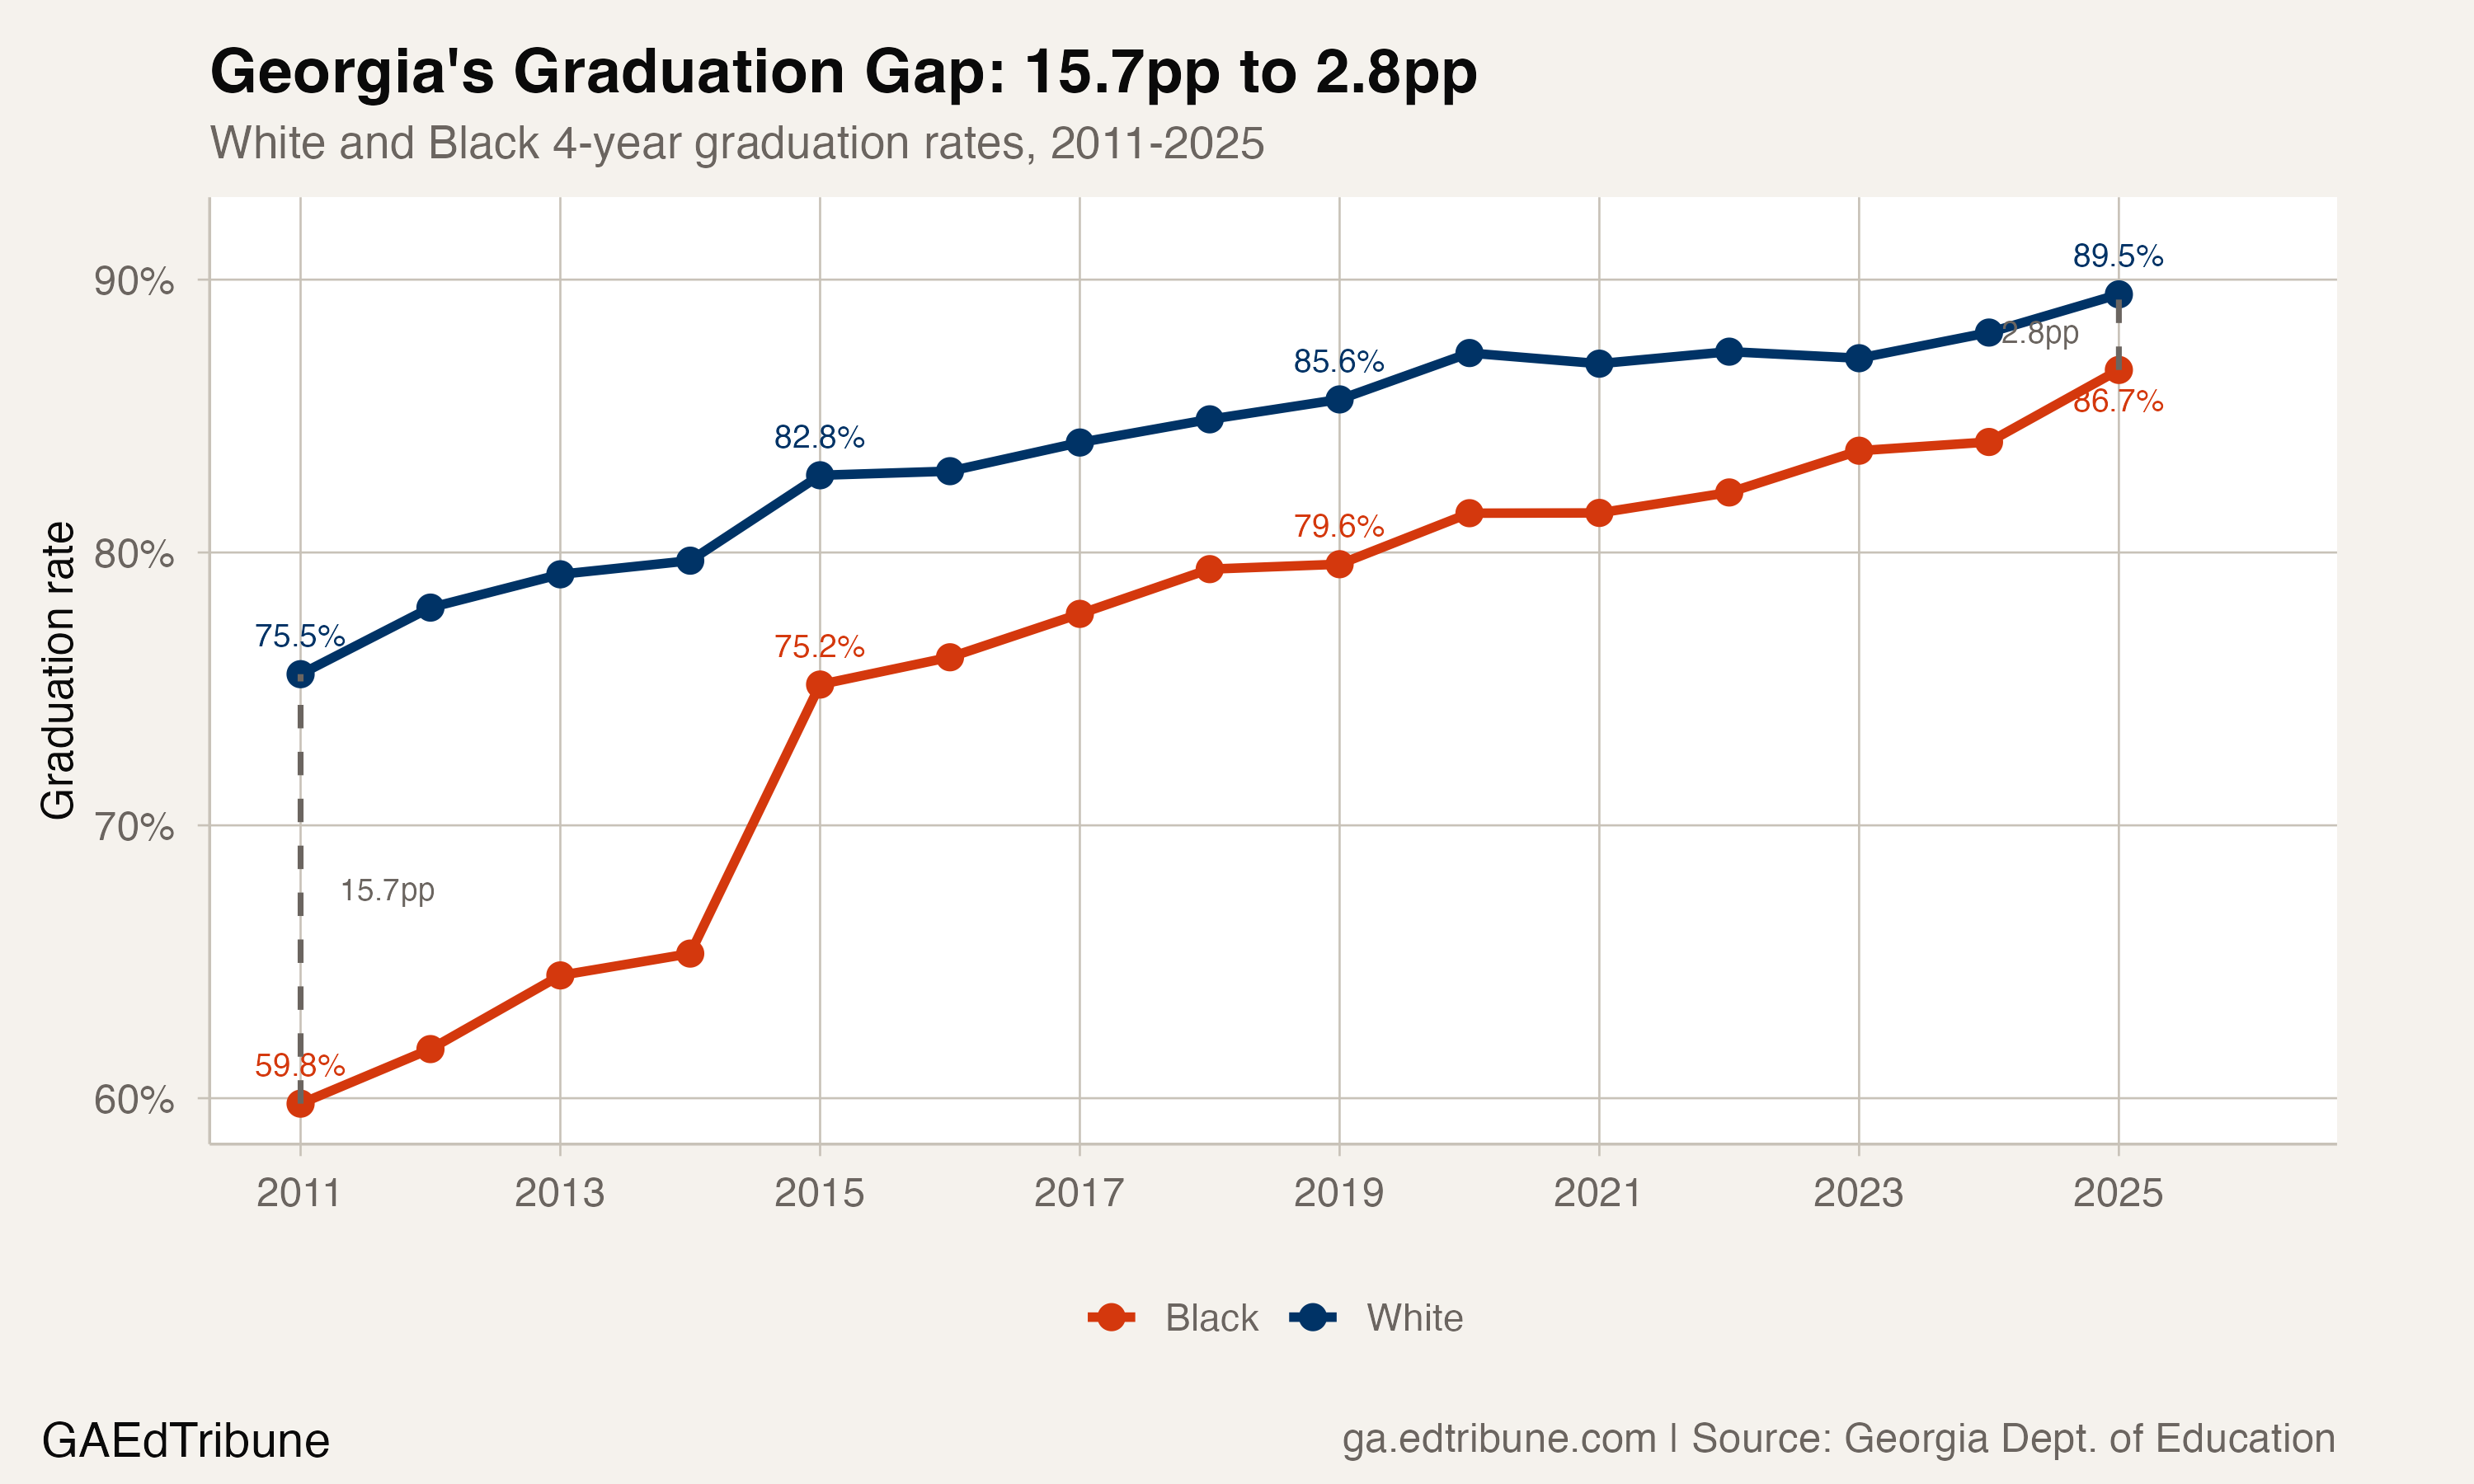
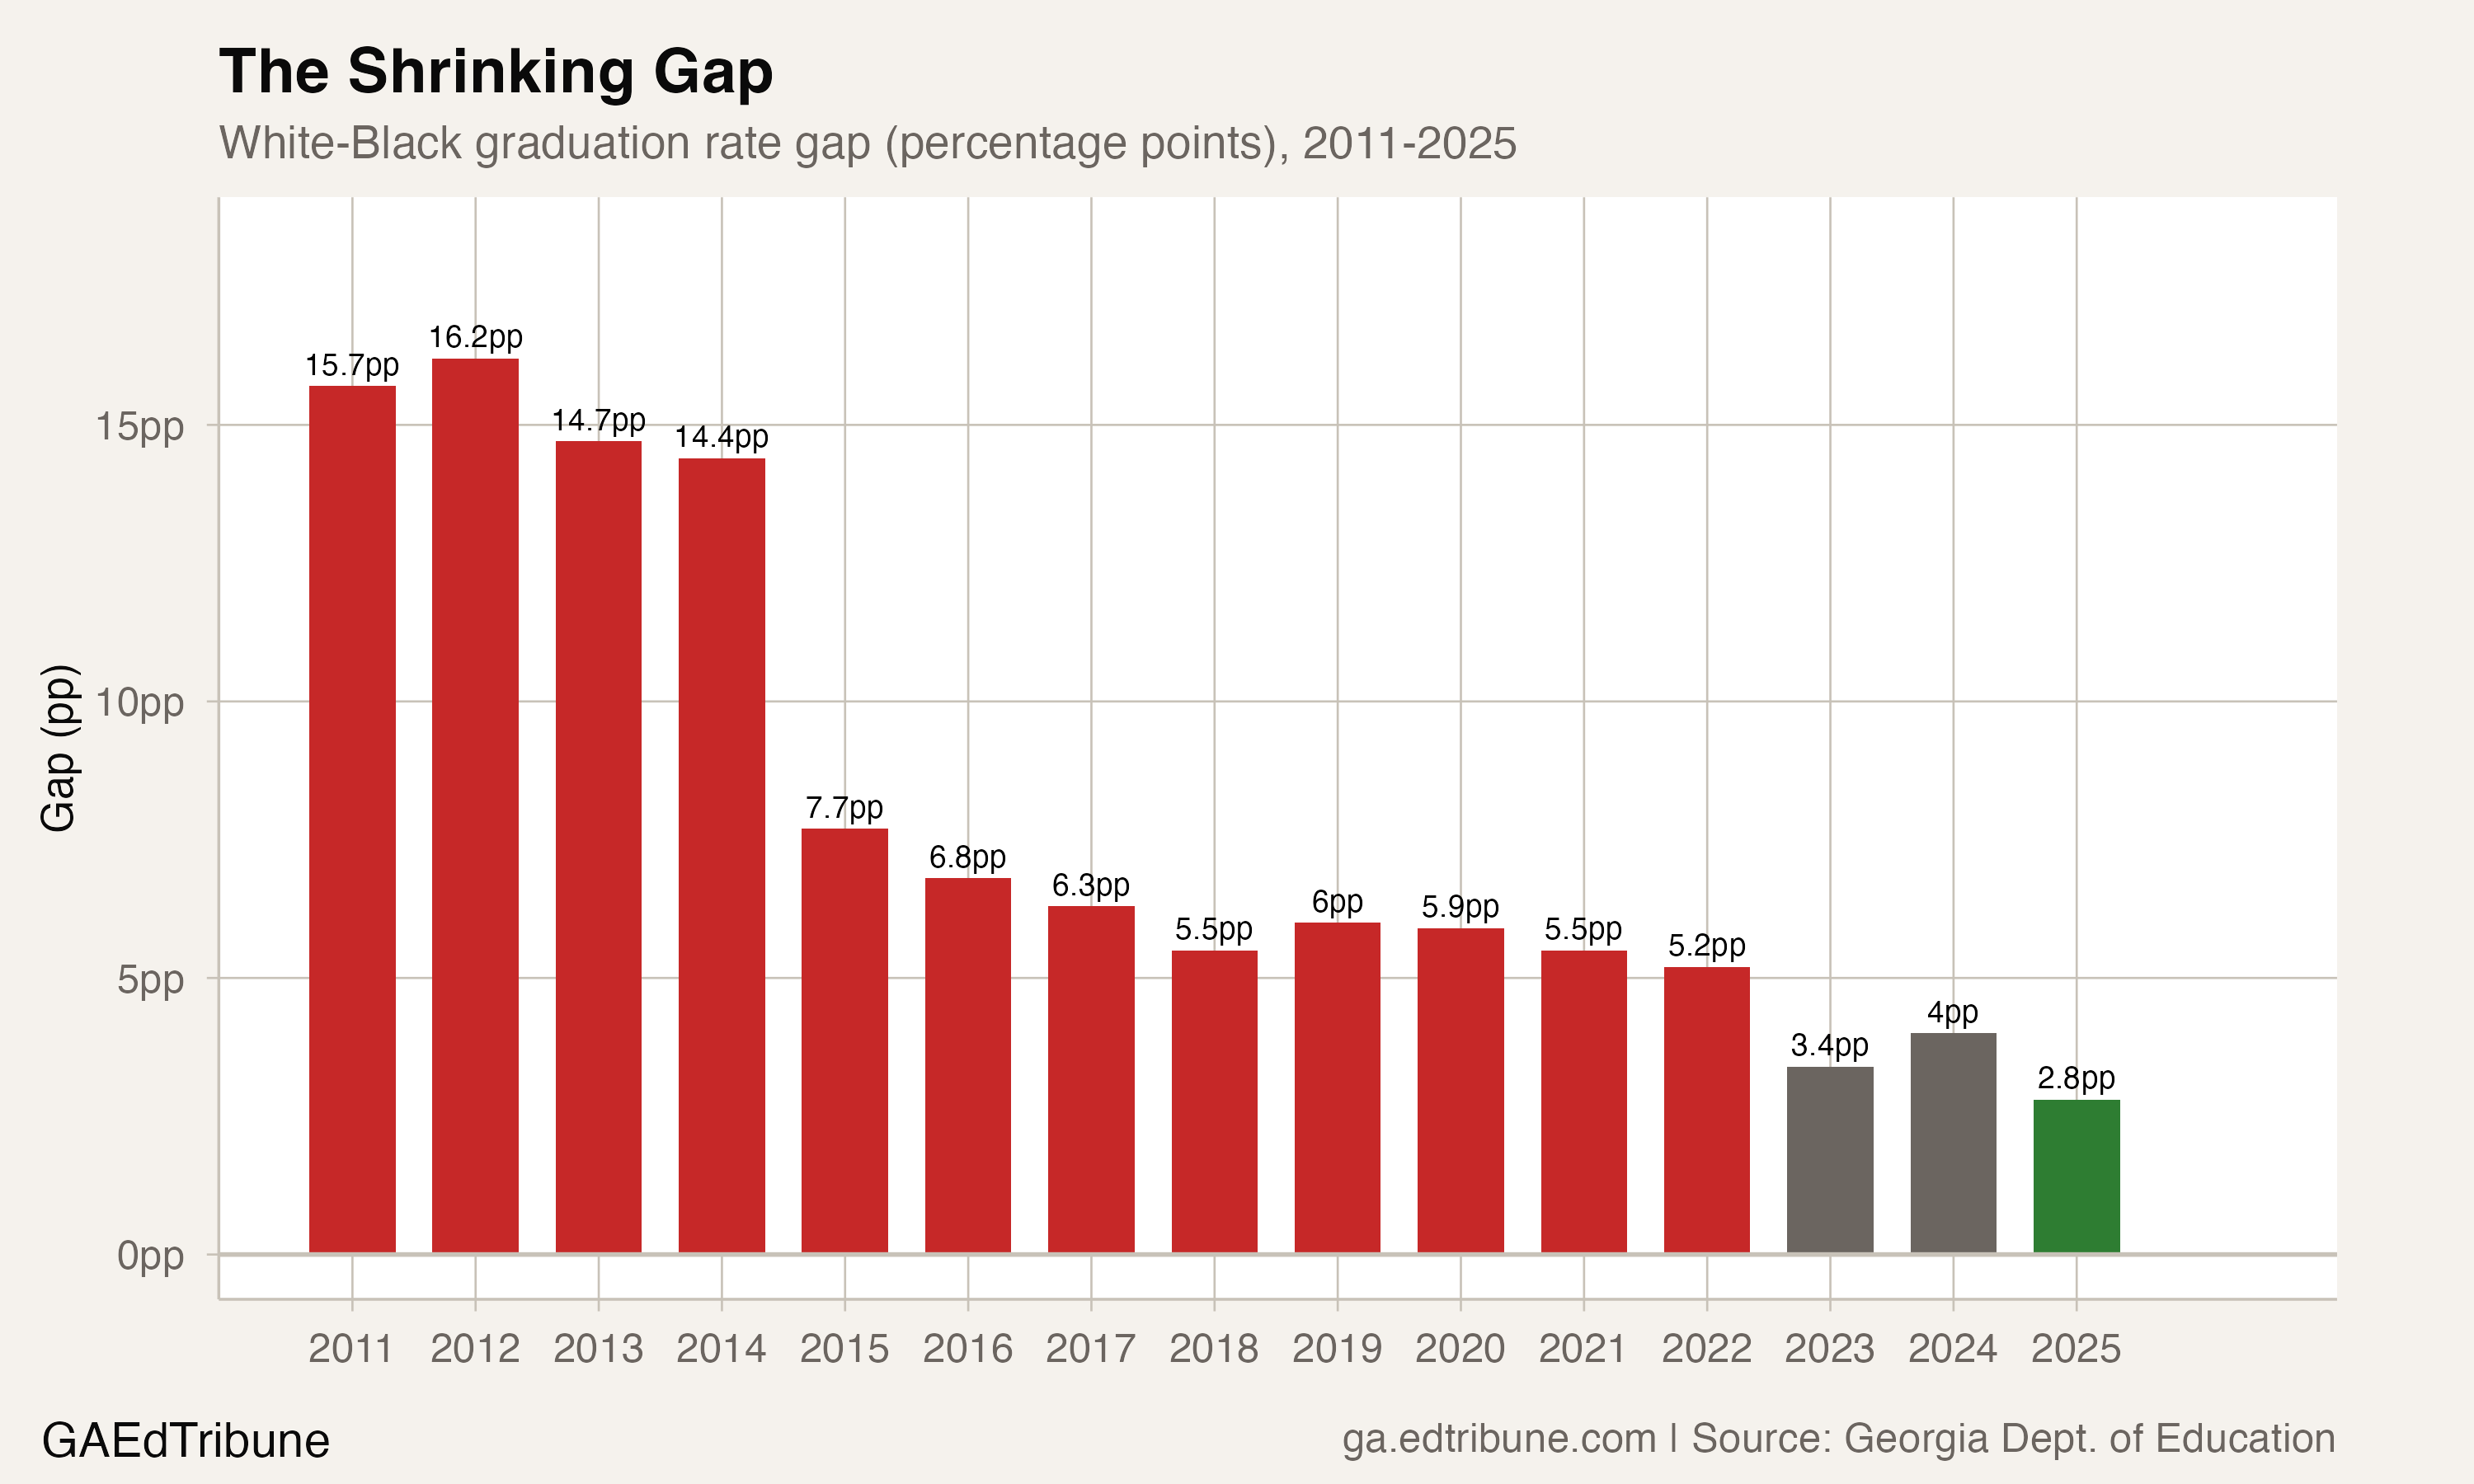
Clayton is not alone. Across 154 Georgia districts that report graduation rates for both groups, 78 now have a Black graduation rate that meets or exceeds the white rate. The statewide white-Black gap, which stood at 15.7 percentage points in 2011, has collapsed to 2.8 points. It is one of the smallest such gaps of any state in the country.
26.9 points in 14 years
The trajectory is not subtle. In 2011, 59.8% of Black students in Georgia graduated within four years. By 2025, that figure reached 86.7%, a gain of 26.9 percentage points. White students improved too, from 75.5% to 89.5%, but at roughly half the pace: 13.9 points over the same period.
The national white-Black graduation gap stood at roughly 9 percentage points in 2021-22, the most recent year of federal data, with white students at 90% and Black students at 81%. Georgia's 2025 gap of 2.8 points is less than a third of that benchmark, and the state's Black graduation rate of 86.7% exceeds the national Black average by nearly 6 points.
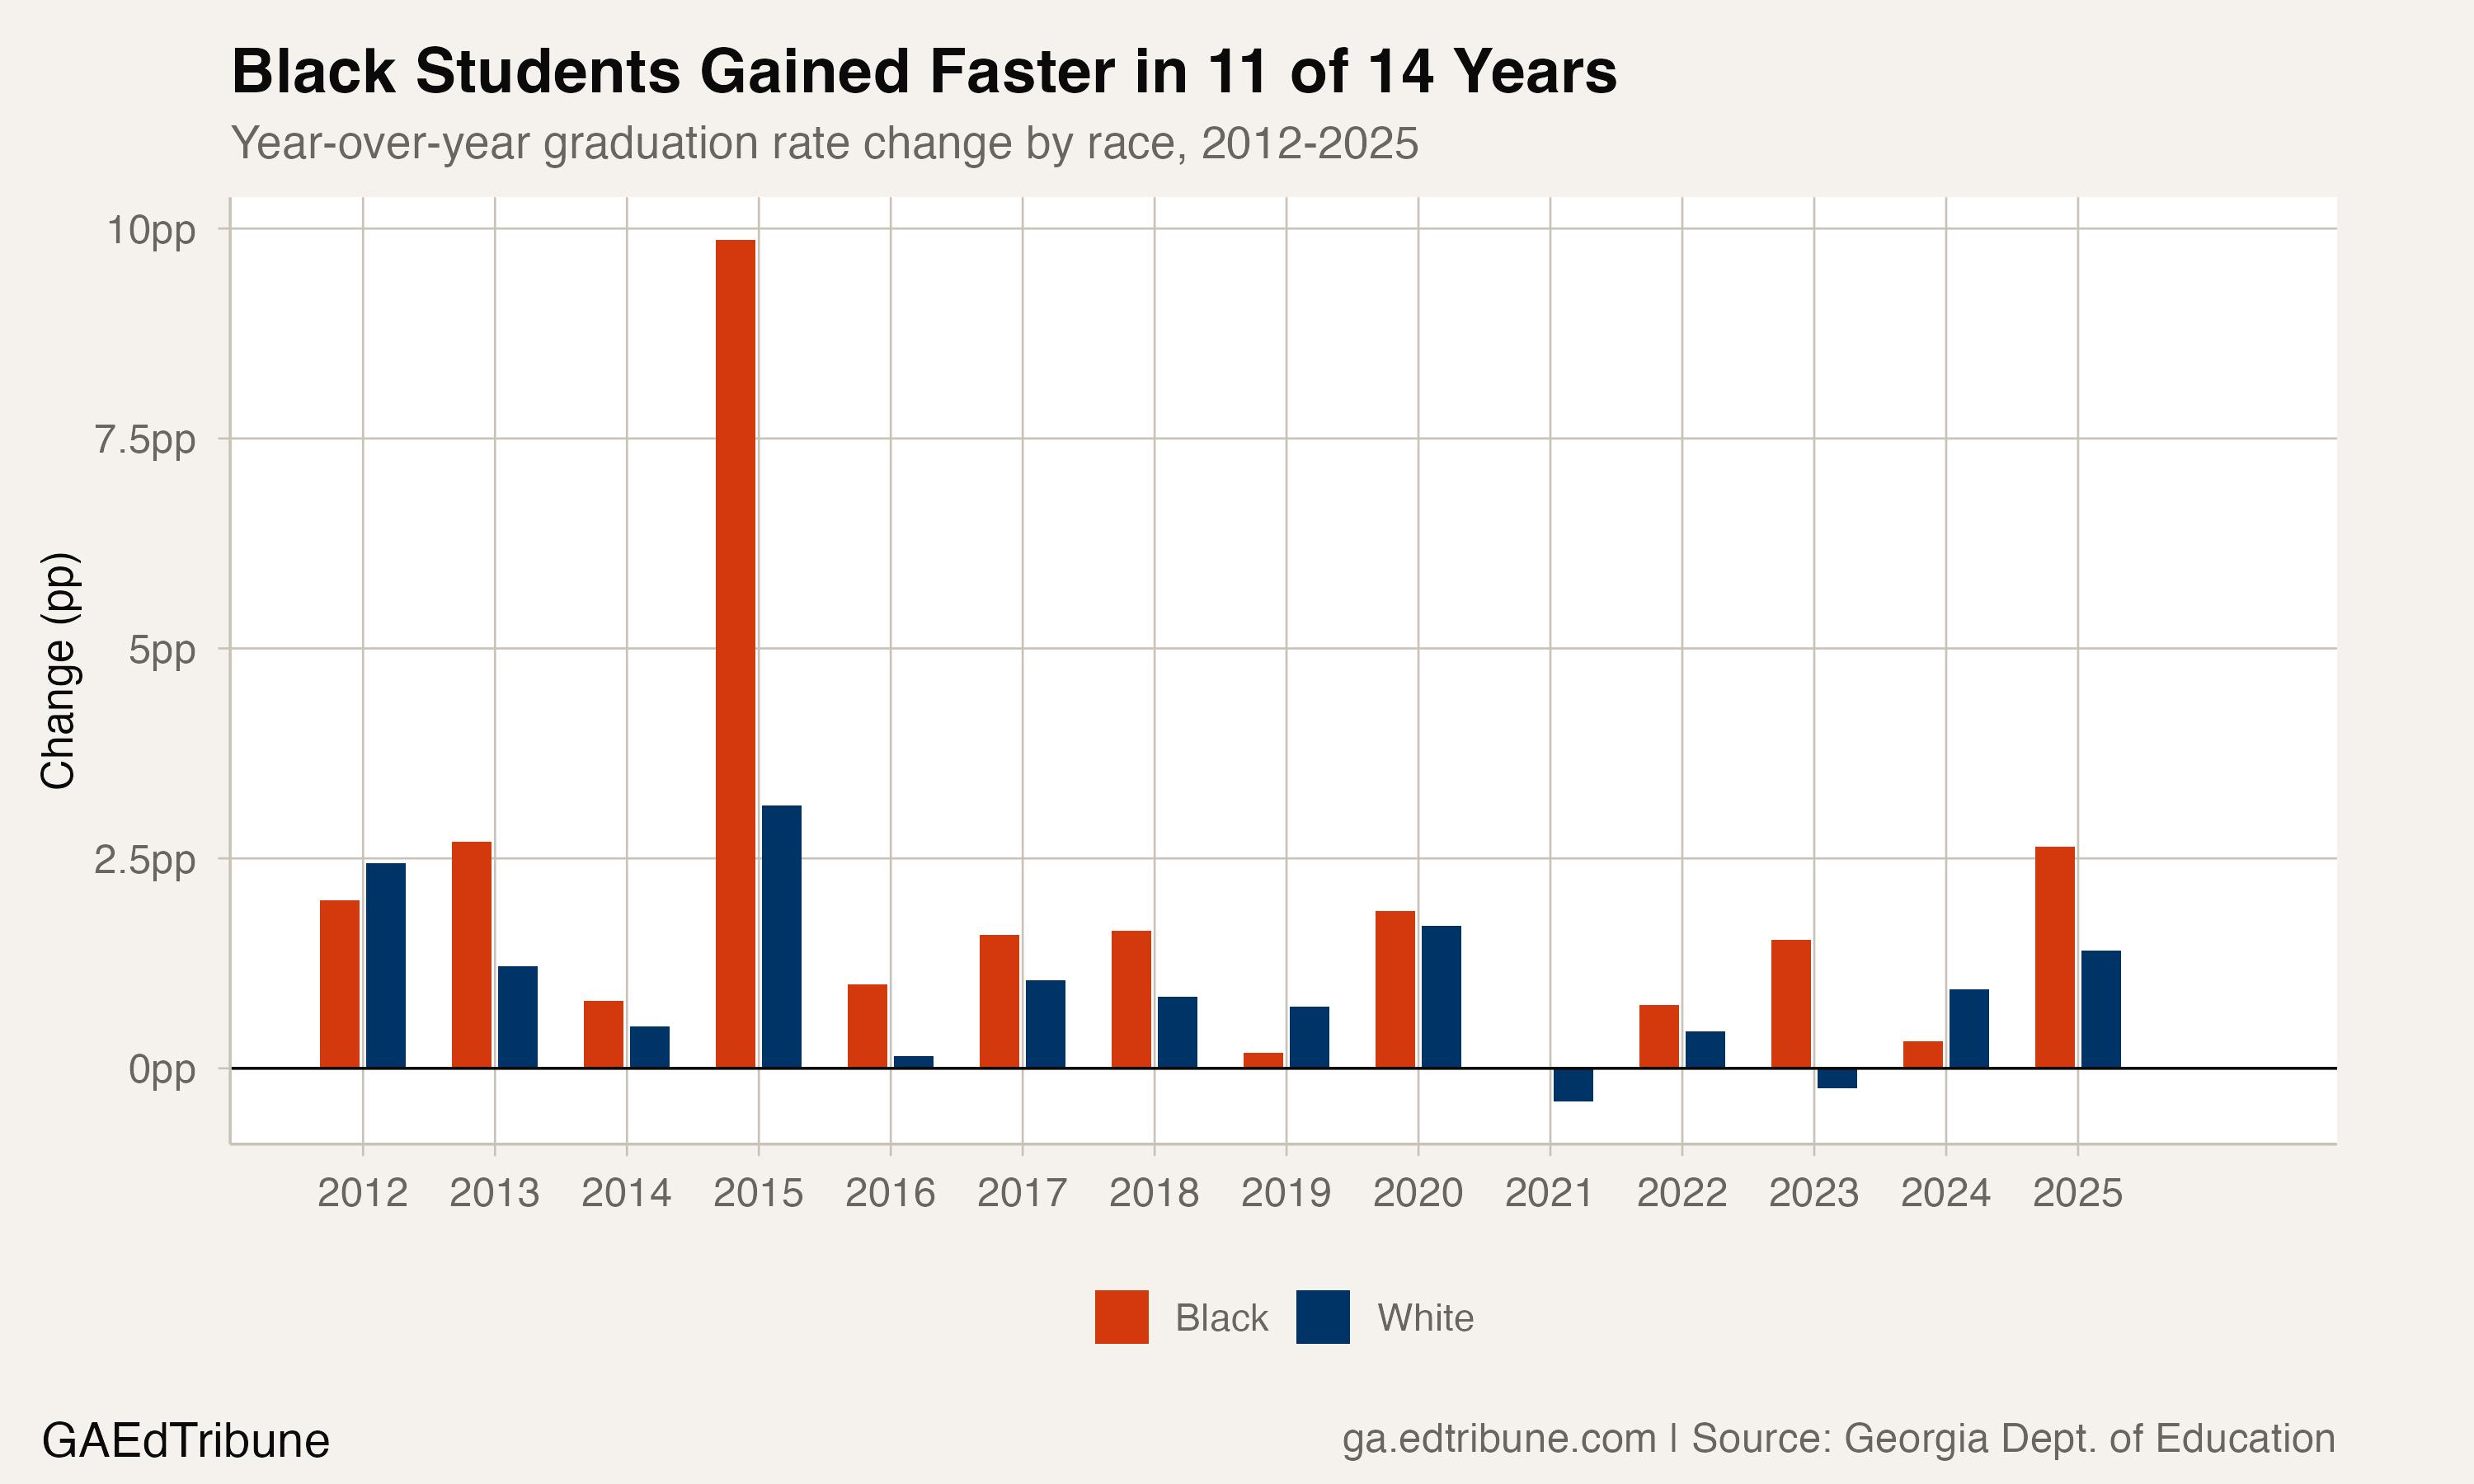
Black students outpaced white students in year-over-year improvement in 11 of 14 years between 2012 and 2025. The three exceptions were 2012, 2019, and 2024, when the white rate gained slightly more. In every other year, the gap narrowed.
The 2015 break and what followed
One year demands scrutiny. Between 2014 and 2015, the statewide gap dropped from 14.4 to 7.7 percentage points in a single year, driven by a 9.9-point jump in the Black graduation rate. Georgia adopted changes to its diploma requirements and cohort calculation methodology around this time. The improvement is real but partially reflects how graduates are counted, not purely how many more students crossed the stage.
After that break, the gap hovered between 5 and 7 points for five years. Then it accelerated. From 2019 to 2025, the gap fell from 6.0 to 2.8 points. More than half of the post-2015 gap closure happened in these six years.
The 2025 gain for Black students was the largest annual improvement since the 2015 methodology shift: 2.6 percentage points in a single year, pushing the rate from 84.0% to 86.7%. For white students, the gain was 1.4 points.
A cohort crossover
Buried beneath the rate improvement is a demographic shift. In 2011, the white senior cohort (58,295) outnumbered the Black cohort (53,436) by nearly 5,000 students. By 2025, those numbers had flipped: 52,787 Black students entered the graduation pipeline compared to 49,138 white students.
The practical consequence: Georgia now produces more Black graduates in raw numbers than white graduates. In 2025, 45,759 Black students earned diplomas versus 43,958 white students. In 2011, the figures were 31,957 and 44,035. Black graduates nearly doubled while the white graduate count held roughly constant.
What is driving the improvement
State School Superintendent Richard Woods has attributed the gains to credit recovery programs, tutoring, and targeted support for at-risk students. At Skyview High School in Fulton County↗ET, one-on-one teacher goal-setting sessions produced an 8.4-point increase in a single year. Douglas County↗ET credited risk intervention programs for pushing its rate above 90%.
Credit recovery, which allows students to retake failed courses, is the most commonly cited mechanism. Georgia's Virtual Learning program offers credit recovery sessions statewide. The approach is credited with keeping students on track to graduate, but it also carries questions about rigor. A former teacher in Paulding County↗ET described to Education Week a system where students completed courses entirely at home, unsupervised:
"Students could cheat by Googling answers using actual students' tests. These students were acing exams in an impossibly small amount of time, in contrast to my on-campus students who usually failed." -- Education Week, November 2023
This does not mean Georgia's gap closure is illusory. But it raises a question the graduation rate alone cannot answer: whether the students walking across the stage are more prepared than their predecessors, or simply better served by a system designed to get them there.
Not every group improved equally
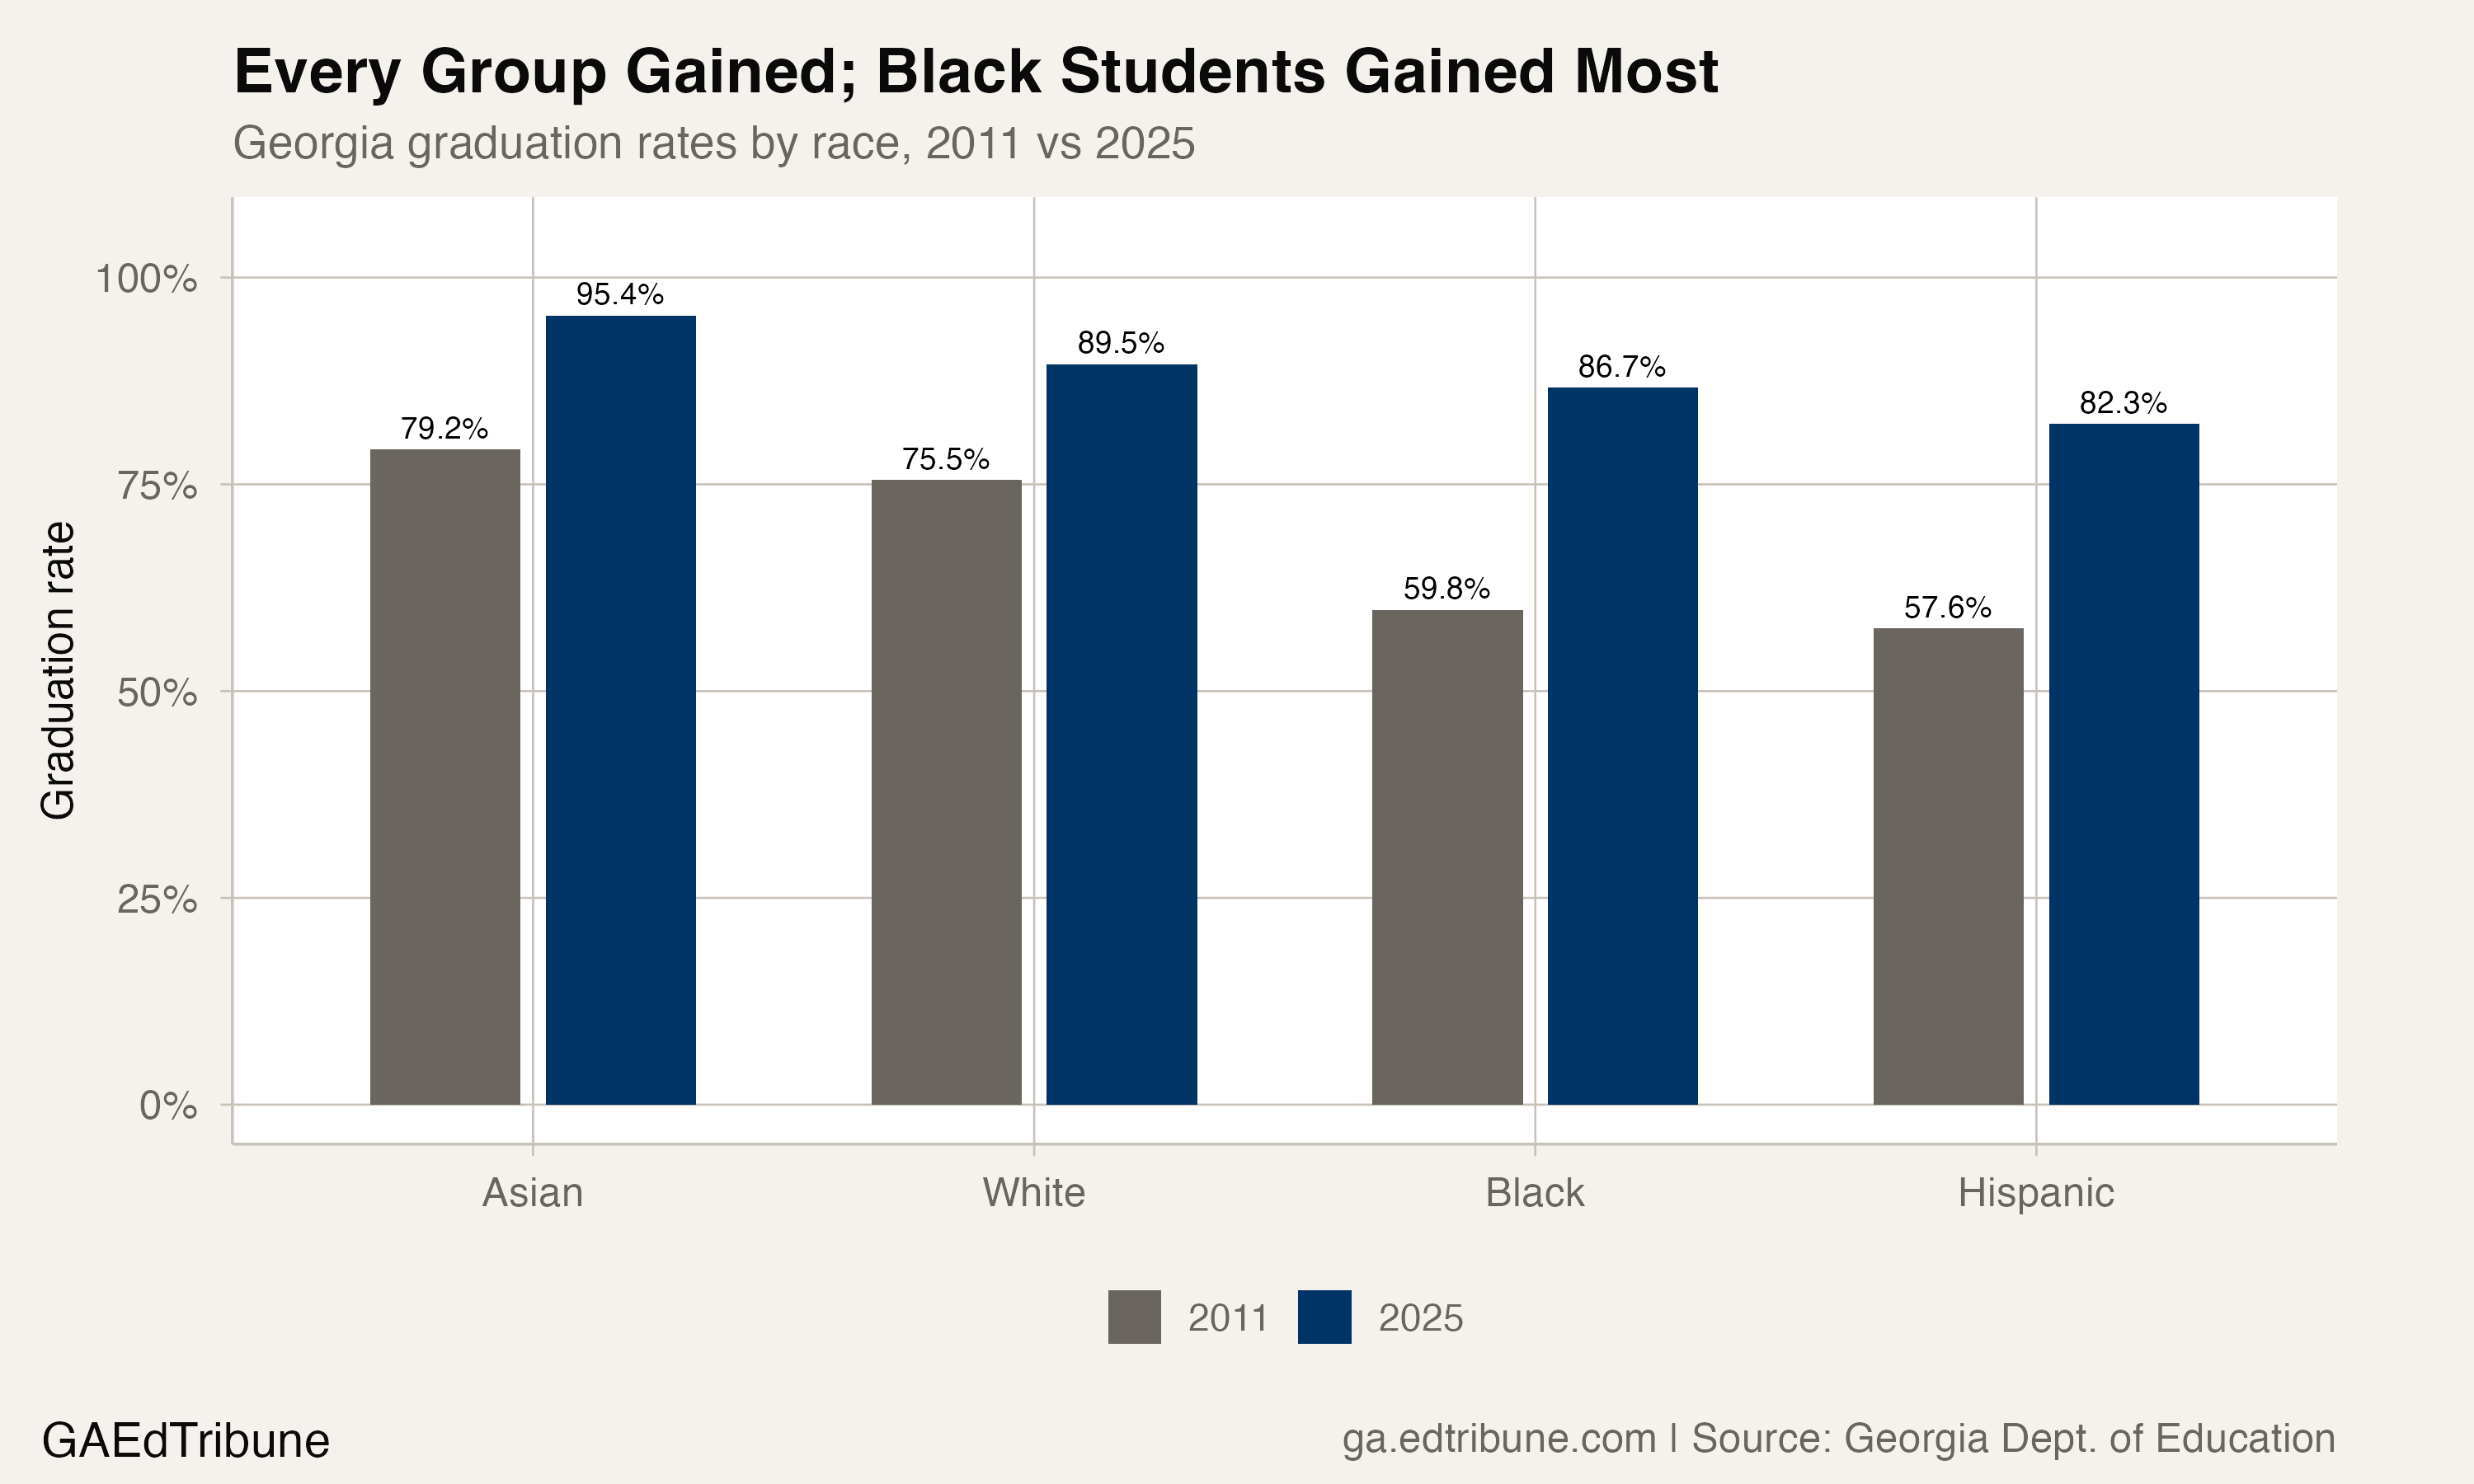
Black students' 26.9-point gain was the largest of any racial group, but it was not the only notable improvement. Hispanic students rose from 57.6% to 82.3%, a 24.7-point gain, though the white-Hispanic gap remains wider at 7.2 points. Asian students climbed from 79.2% to 95.4%.
The income gap tells a different story. Economically disadvantaged students graduated at 86.0% in 2025, compared to 89.5% for their non-disadvantaged peers, a gap of 3.5 points. That gap has narrowed substantially from the 15.2-point spread in 2011, but Georgia remains one of only eight states that does not provide additional funding to schools based on student poverty, a structural limit on how far targeted interventions alone can push outcomes.
Students receiving special education services graduated at 78.4%, up from 29.8% in 2011, a gain of 48.6 points. The improvement is staggering, though it also reflects expanded definitions of which students are counted in the cohort and how alternative completions are classified.
The district picture is mixed
The statewide gap is 2.8 points. The district-level reality is far more varied.
Among the 15 districts with the largest Black senior cohorts, Fulton County↗ET had the widest white-favoring gap at 9.8 points. Atlanta Public Schools↗ET had an 8.2-point gap. DeKalb County↗ET, where Black students make up more than 80% of the cohort, had an 8.1-point gap.
On the other side, Clayton County↗ET posted an 11.4-point Black-favoring gap, Douglas County↗ET 7.3 points in Black students' favor, and Bibb County↗ET 9.5 points. Henry County↗ET, one of the state's fastest-growing suburban districts, showed a 2.4-point Black-favoring gap.
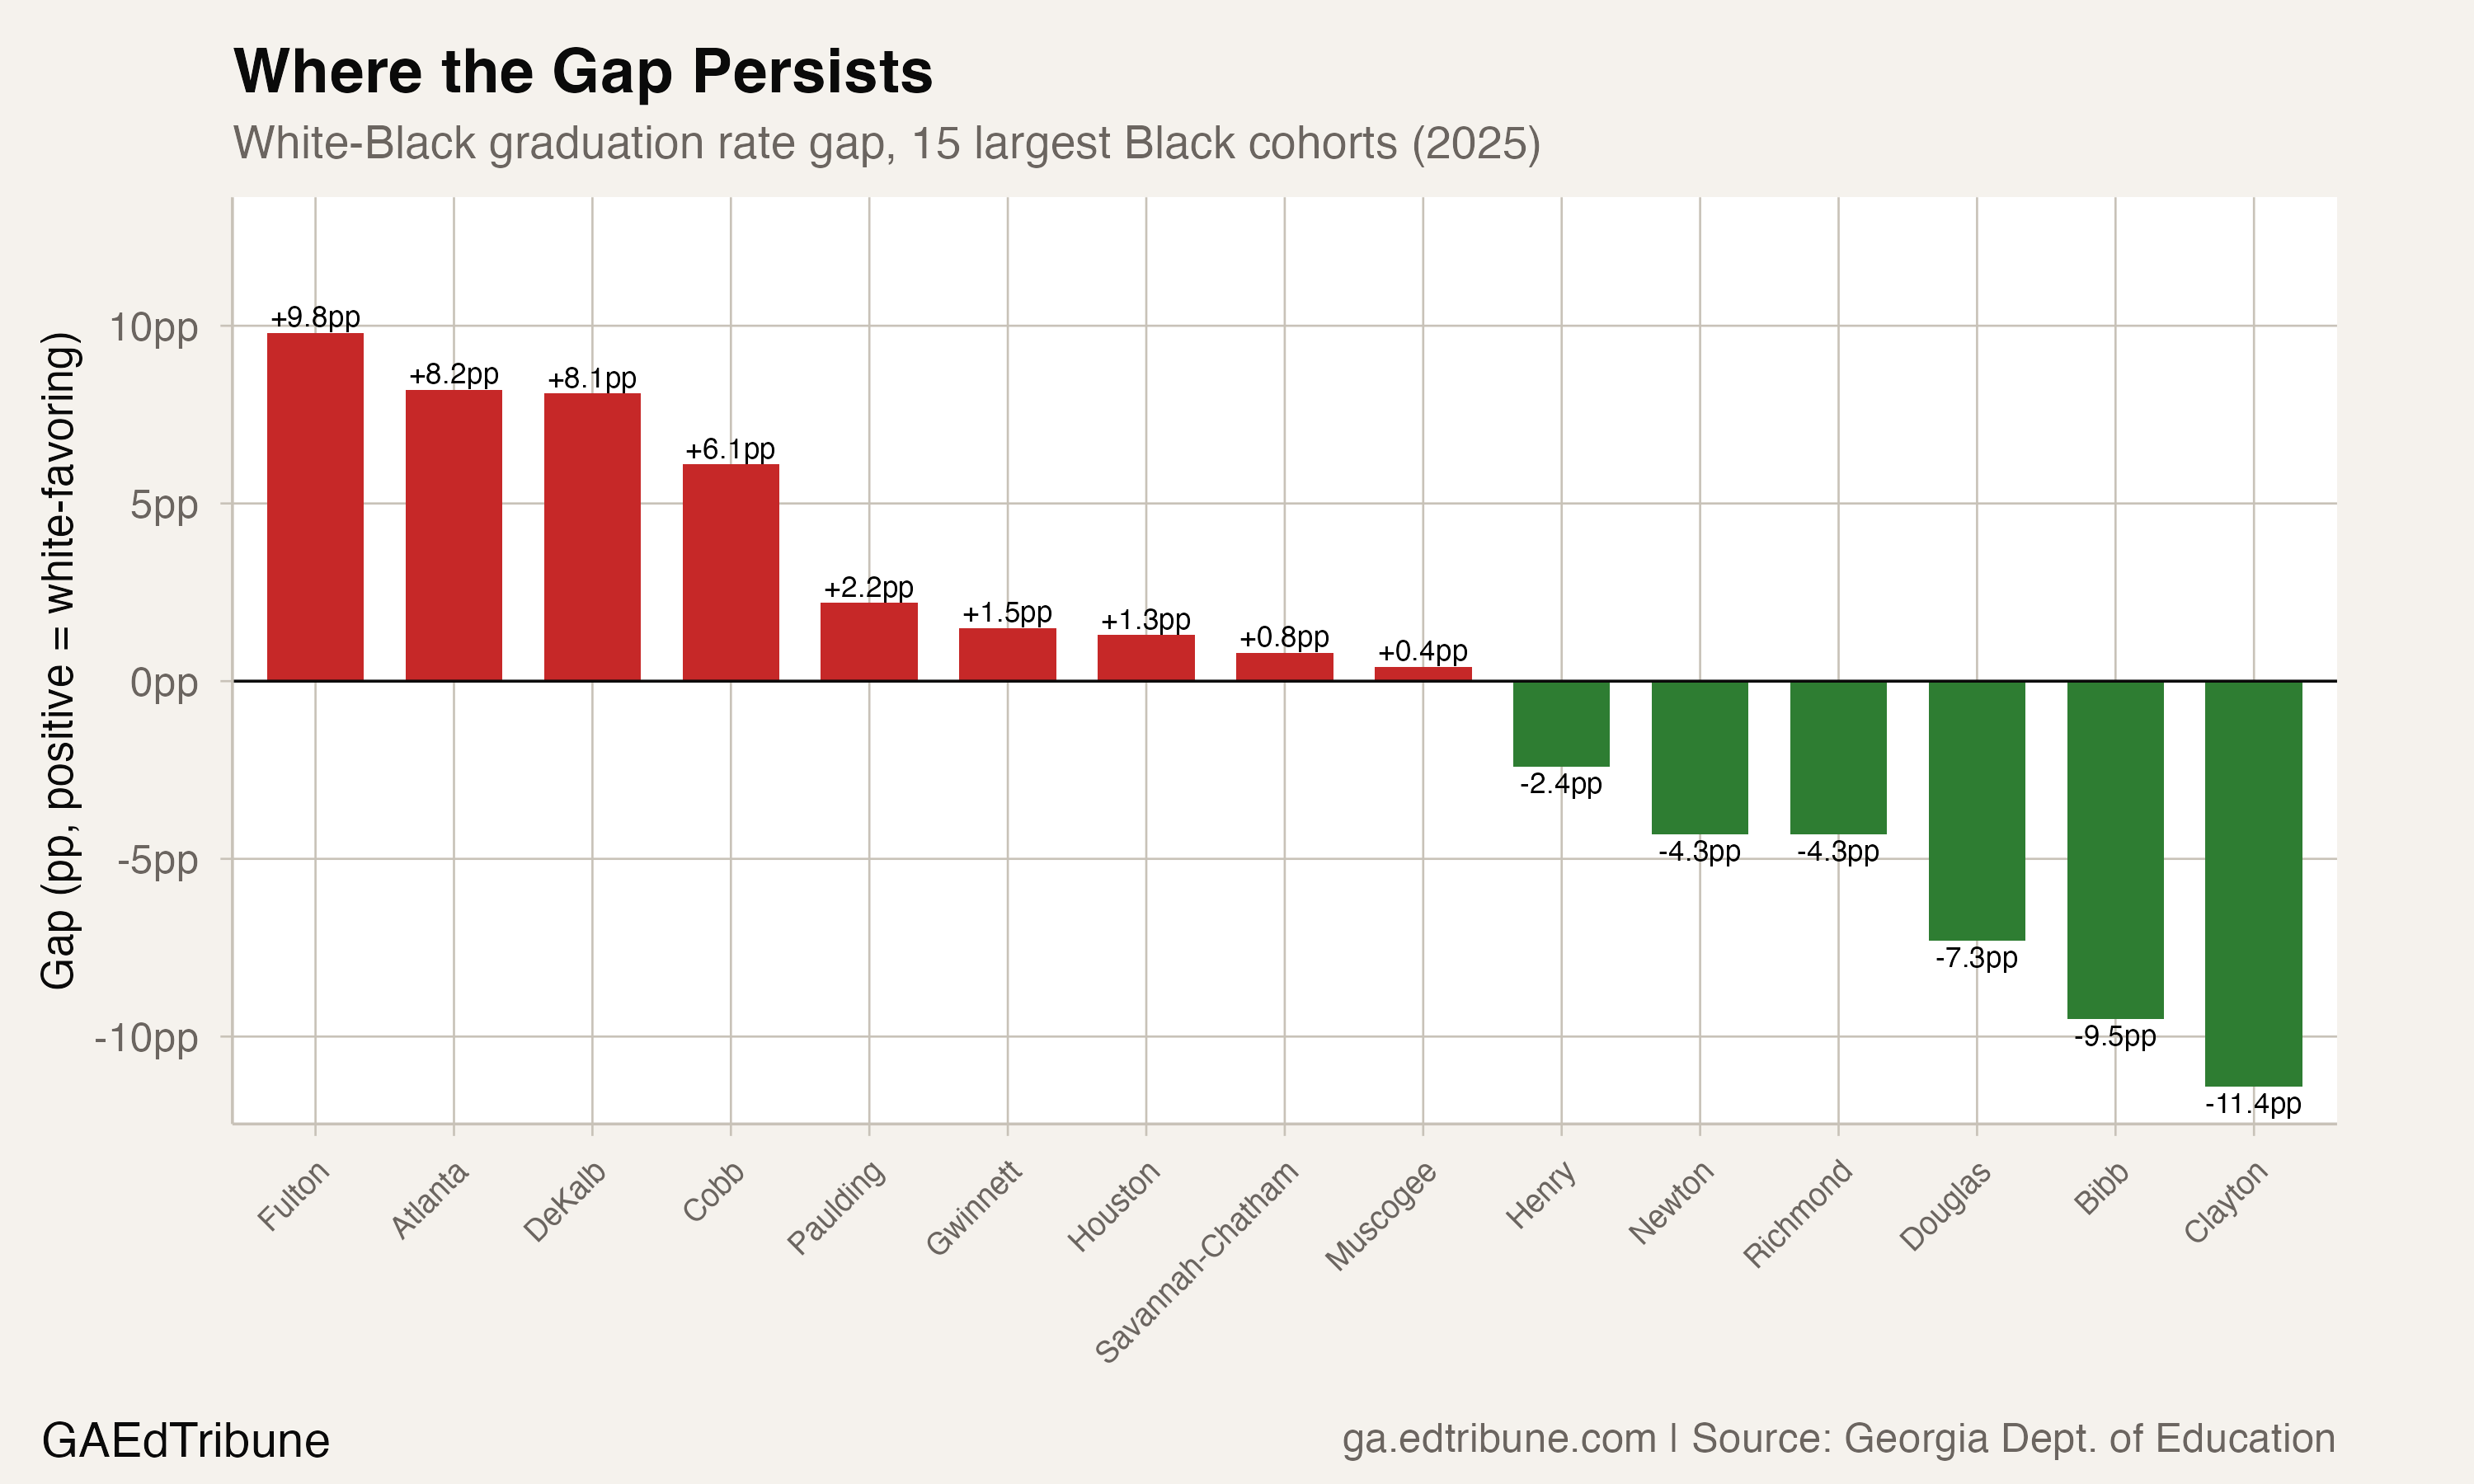
Gwinnett County↗ET, the state's largest district with 5,388 Black seniors, had a gap of just 1.5 points. Muscogee County↗ET was even tighter at 0.4 points, with both groups above 96%.
The question credit recovery cannot answer
Georgia's graduation rate of 87.2% is the highest since the state began calculating the federal four-year adjusted cohort rate in 2011. The white-Black gap of 2.8 points would have been aspirational a decade ago. But the Georgia Budget and Policy Institute's research on the Black Belt, the 69 districts stretching across majority-Black counties in central and south Georgia, found that third-grade reading proficiency in those districts was 25.6%, compared to 40.4% statewide. Eighth-grade math proficiency was 24%.
A graduation rate measures completion. It does not measure what a diploma contains. The 2025 CCRPI results showed improvement in content mastery and college readiness indicators, but the question of whether a narrowing graduation gap corresponds to a narrowing preparation gap remains open. The next meaningful measure is not whether the Class of 2026 graduates at an even higher rate, but whether the 45,759 Black students who earned diplomas in 2025 are landing in postsecondary programs, completing them, and entering careers at rates that match the progress their graduation numbers suggest.
Detailed code that reproduces the analysis and figures in this article is available exclusively to EdTribune subscribers.
Discussion
Sign in to join the discussion.
Loading comments...