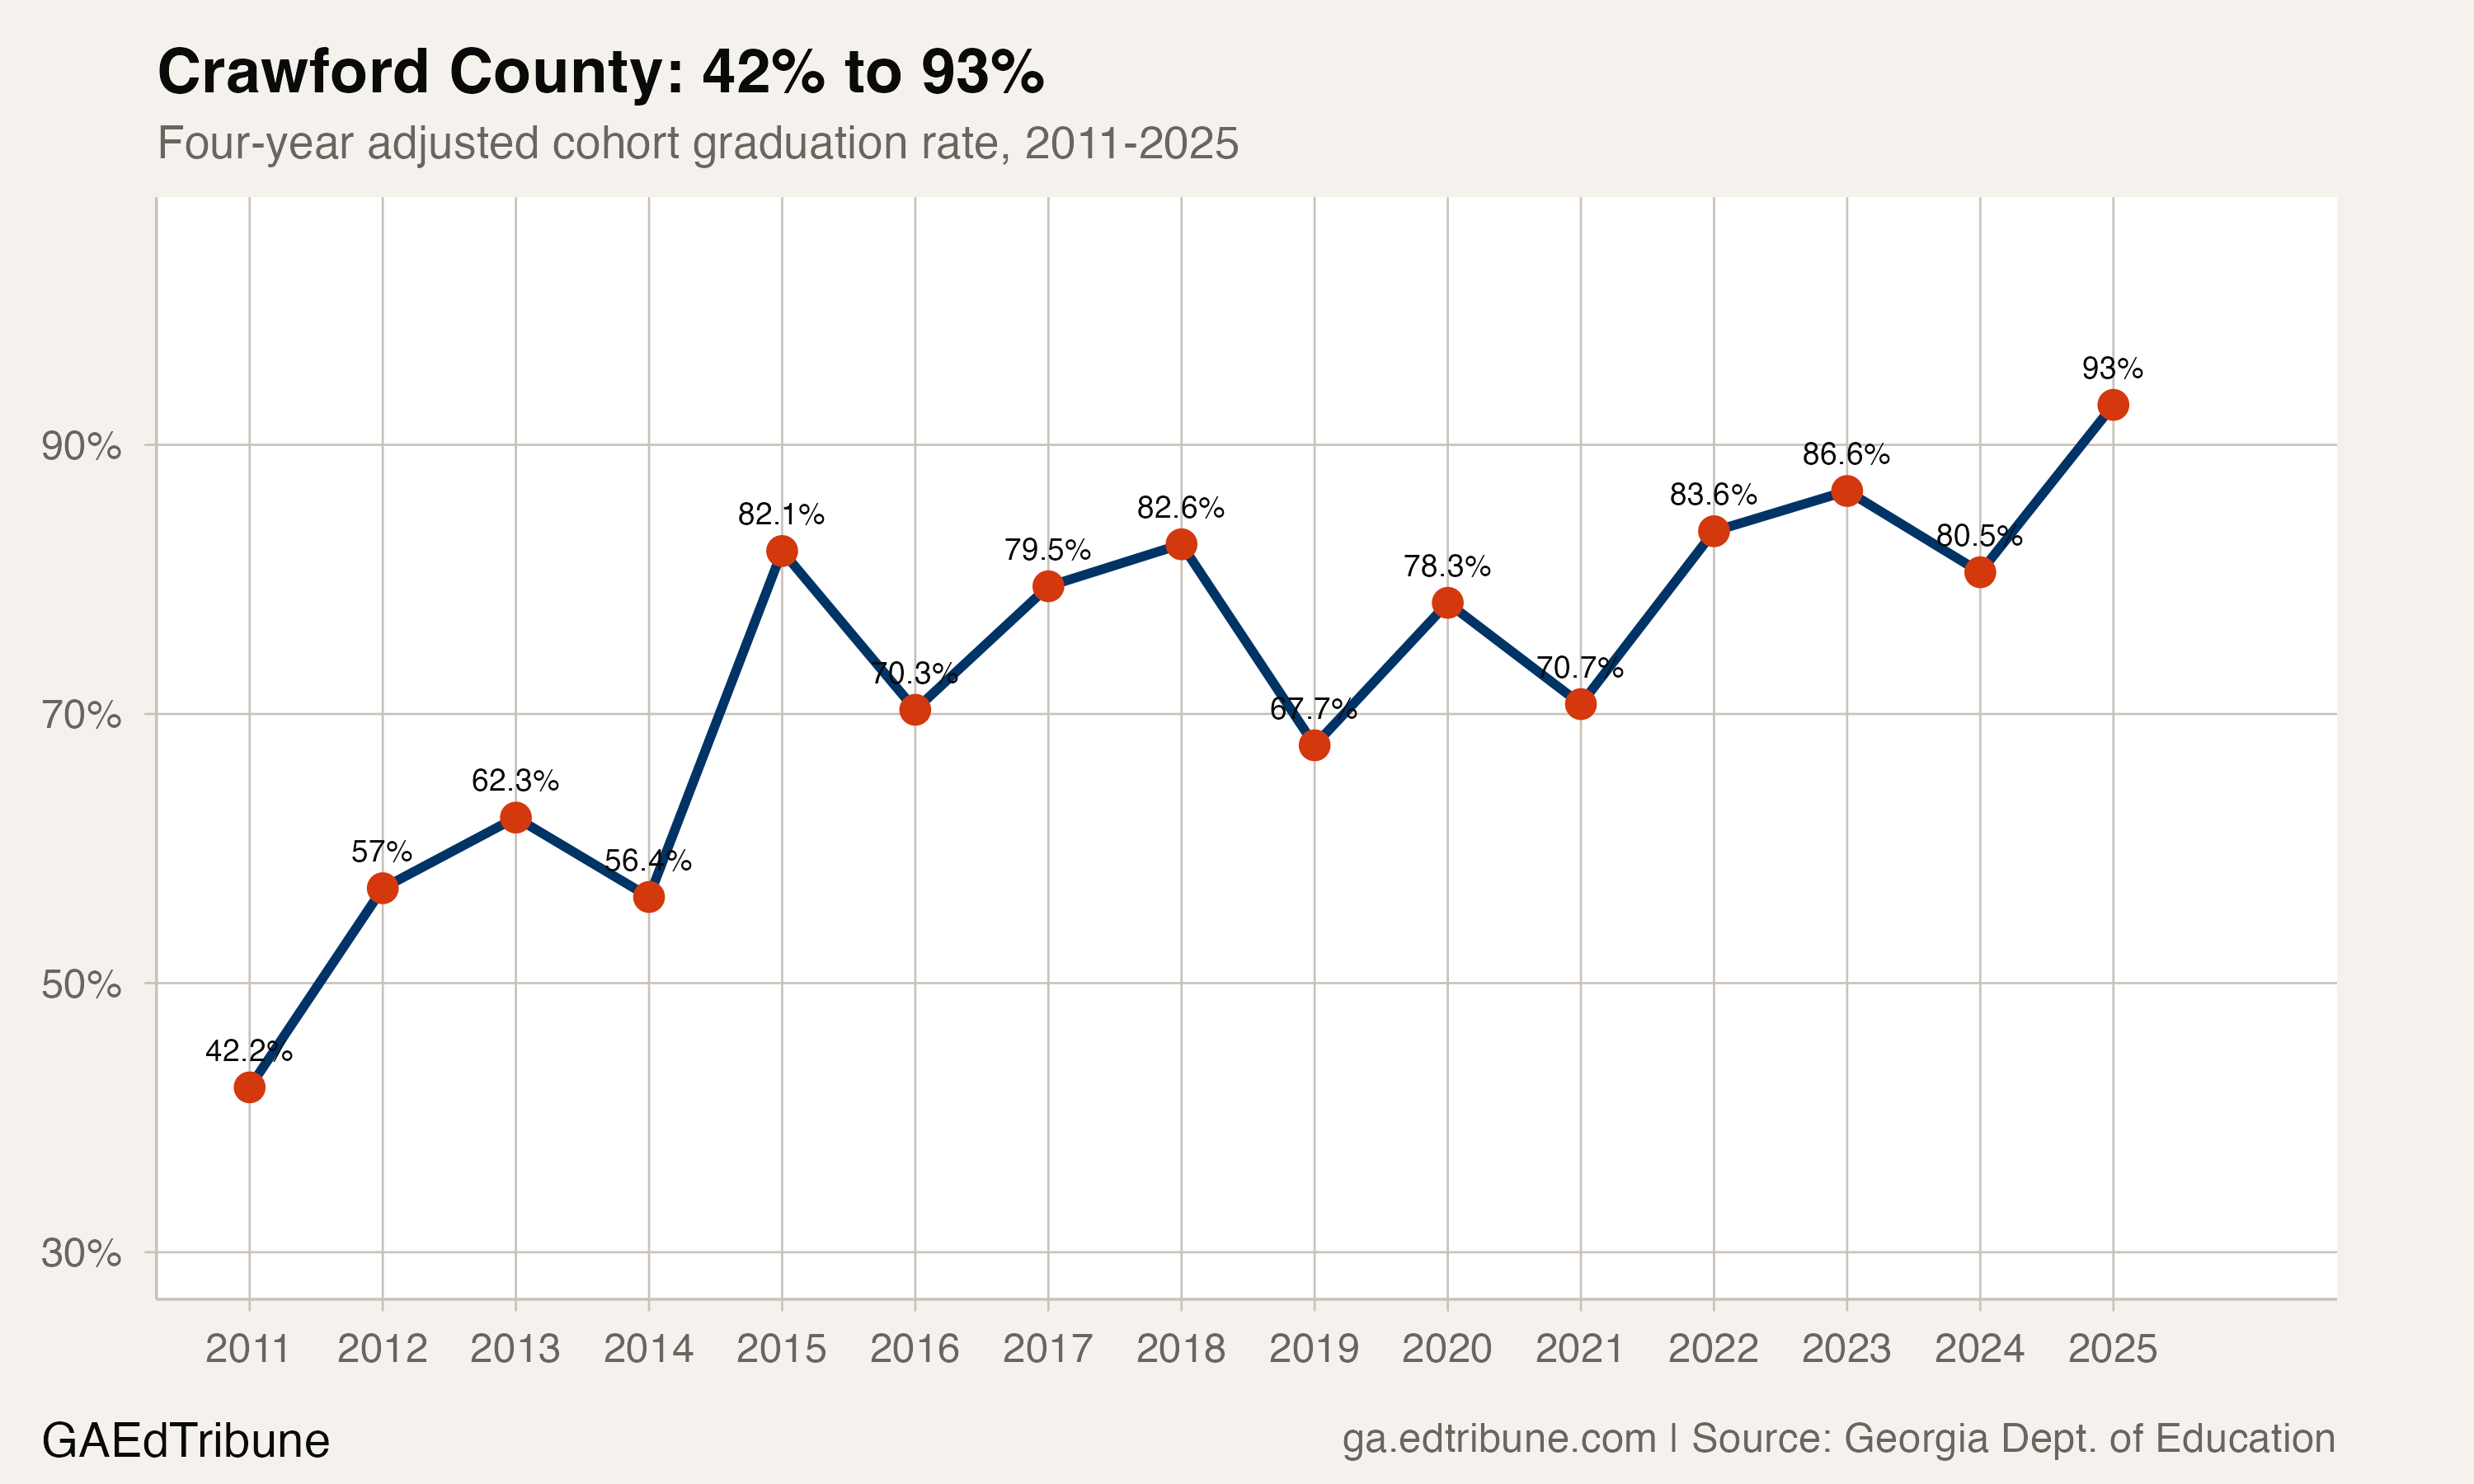
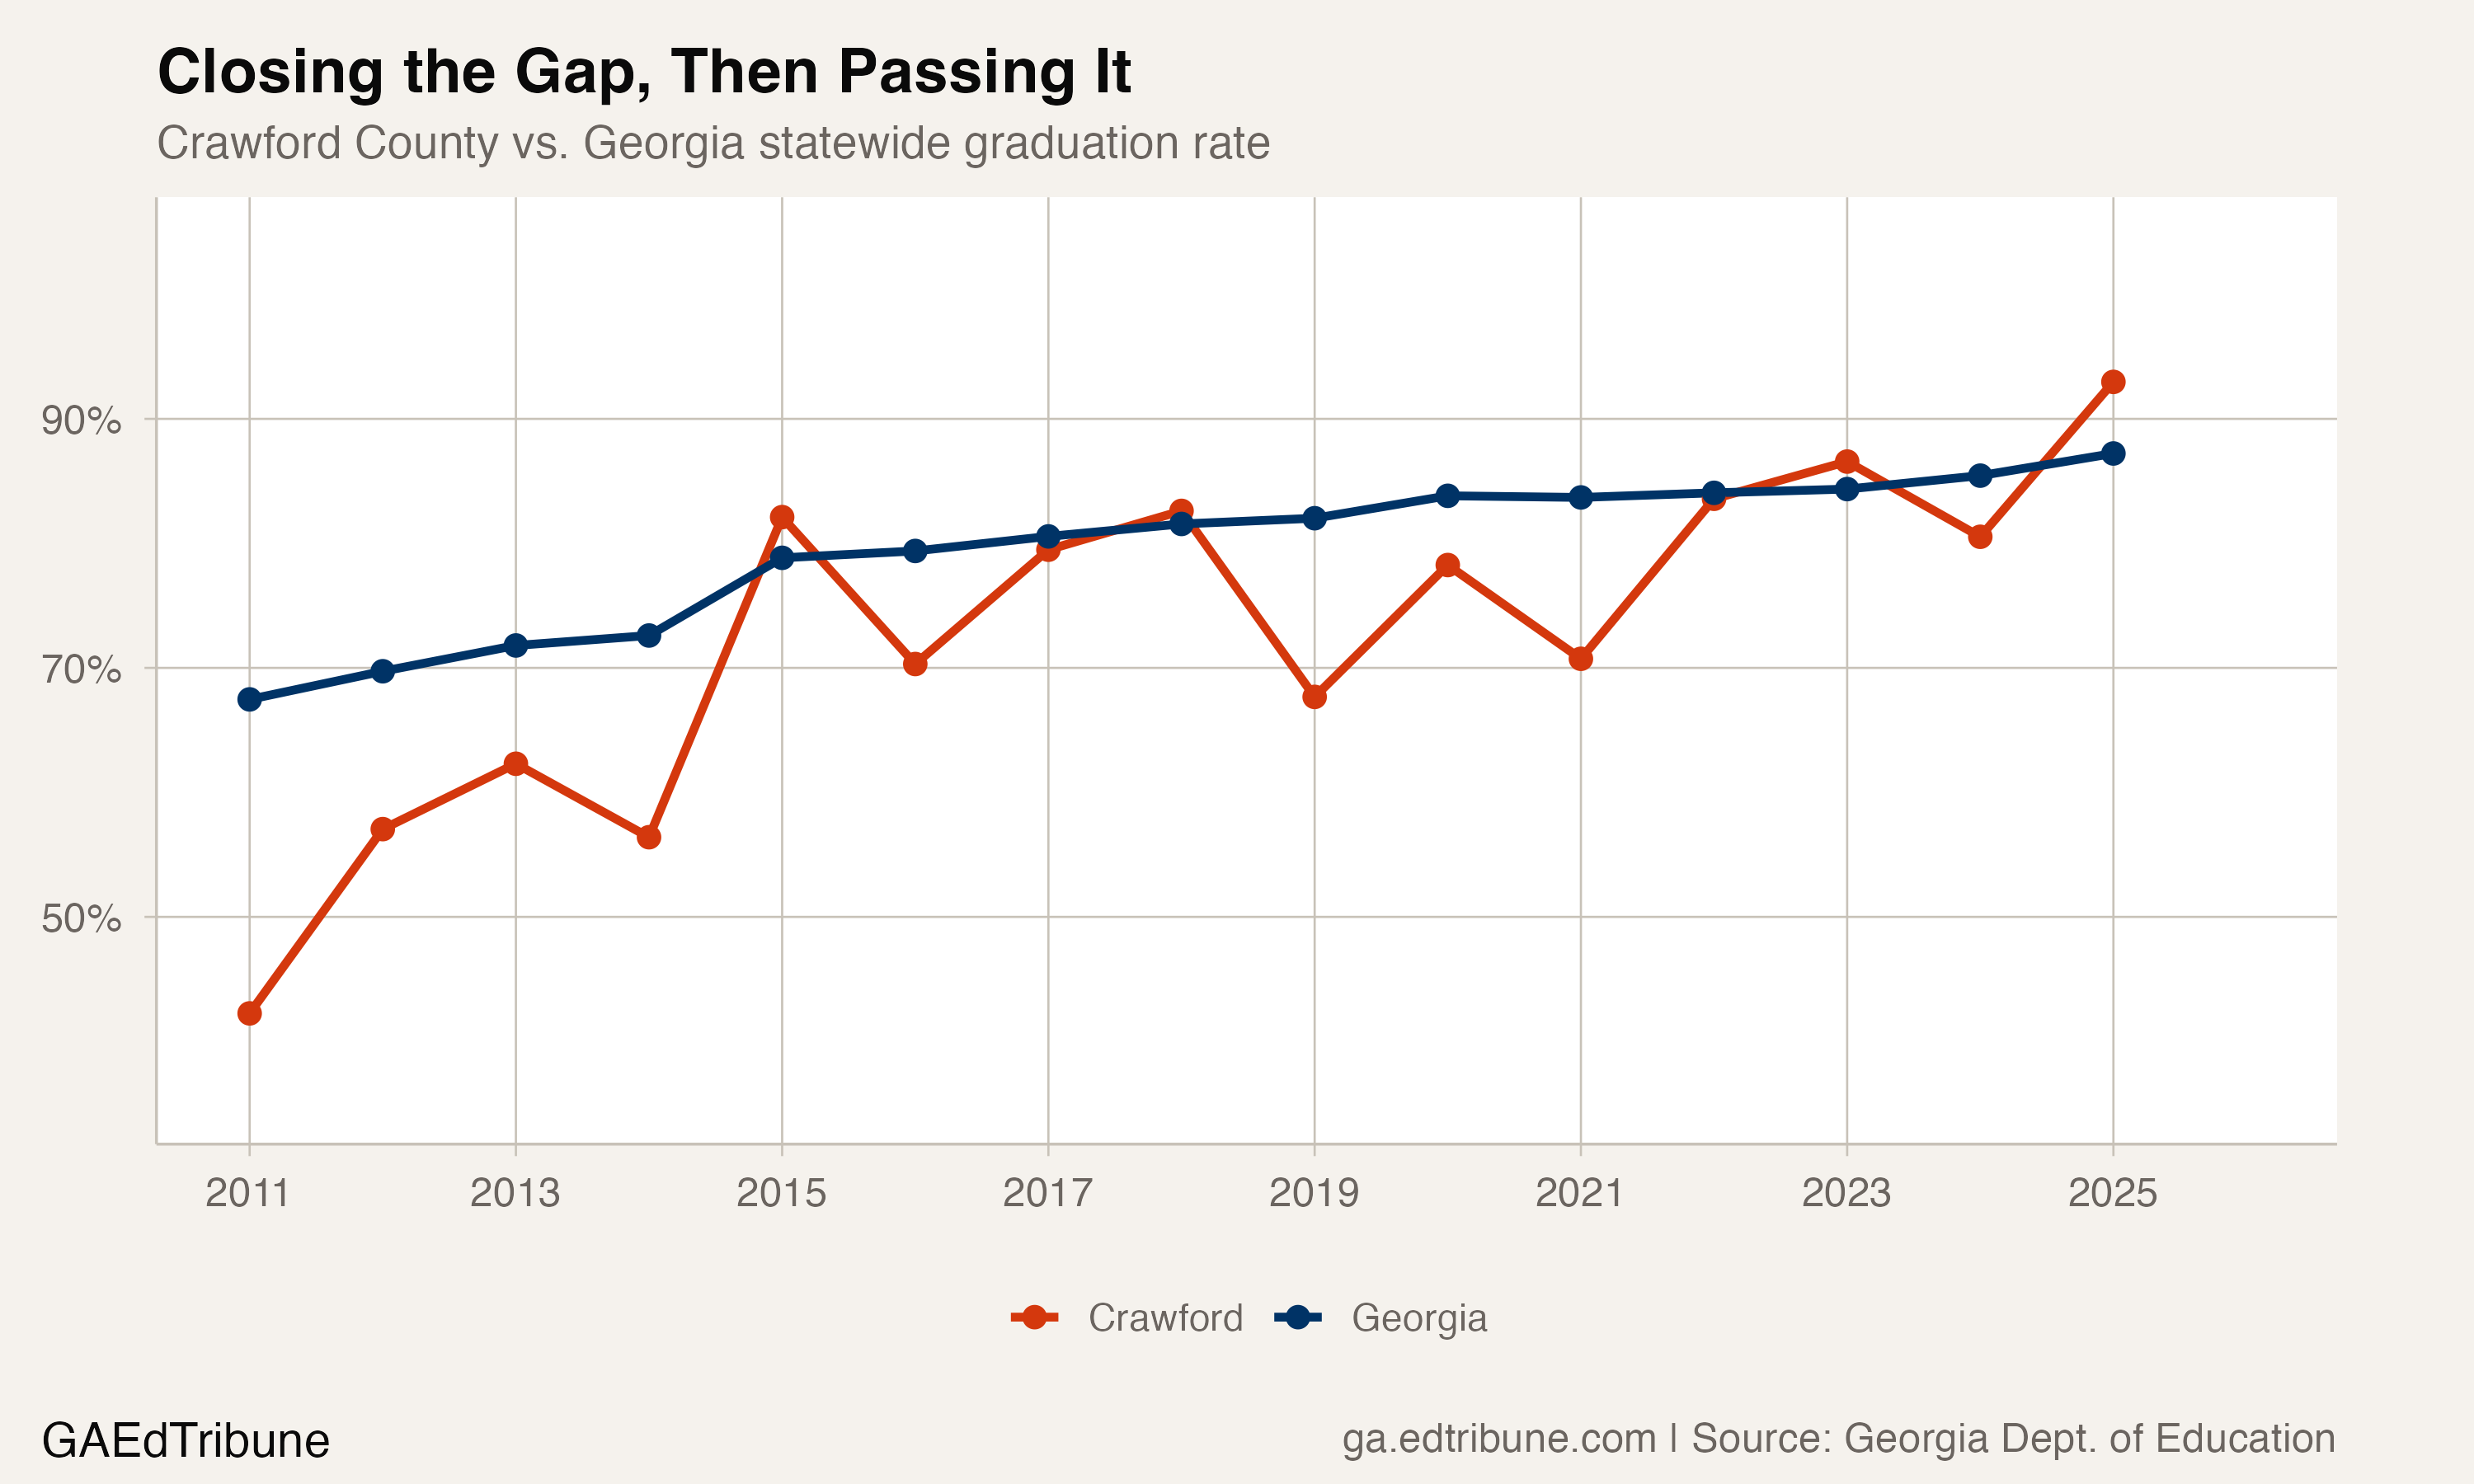
In 2011, Crawford County↗ET graduated 42.2% of its senior class. That placed the small district south of Macon, where a single high school in Roberta serves the county's roughly 1,500 students, among the worst-performing systems in Georgia. Fourteen years later, the Class of 2025 graduated at 93.0%, a 50.7 percentage point gain that represents the second-largest turnaround of any Georgia district since the state adopted the federal adjusted cohort graduation rate.
The improvement did not arrive in a straight line. Crawford's trajectory included a 25.7-point jump between 2014 and 2015 (partly reflecting a statewide methodology refinement that boosted Georgia's overall rate by 6.2 points that year), a backslide to 67.7% in 2019, another dip to 70.7% in 2021, and then a sustained climb through 2025. The path was volatile. But the direction, across the full 14 years, was unmistakable.
A cohort of 128
Crawford County's 2025 graduating class had 128 students. That number matters for two reasons. First, it means the district's gains are not a small-sample illusion. A cohort of 128 is large enough that year-over-year swings reflect real operational changes, even if individual years still carry more noise than a district graduating 3,000. Second, it means the transformation happened at a scale where every student is known by name. Crawford County High School does not have the anonymity of a large suburban campus.
The 2011 cohort was larger, at 187 students, with just 79 graduating on time. By 2025, the district graduated 119 of 128. Among Black students, the rate reached 100% on a cohort of 33, up from 37.8% in 2011. Among economically disadvantaged students, it hit 93.7% on a cohort of 127, up from 32.0%.
That economically disadvantaged figure deserves a caveat: Crawford County participates in the Community Eligibility Provision, which allows districts to classify all students as economically disadvantaged for federal meal programs. The 127-of-128 denominator suggests near-universal CEP classification rather than a precise poverty count. But the graduation rate itself is not inflated by CEP. Those 119 students walked across the stage.
Not just Crawford
Crawford's turnaround is the most extreme case in a broader pattern. Of the 26 Georgia districts that started below 60% in 2011, 15 now graduate above 90%. The median improvement across all Georgia districts was 20.1 percentage points over 14 years, but the districts that started at the bottom outpaced that median by wide margins.
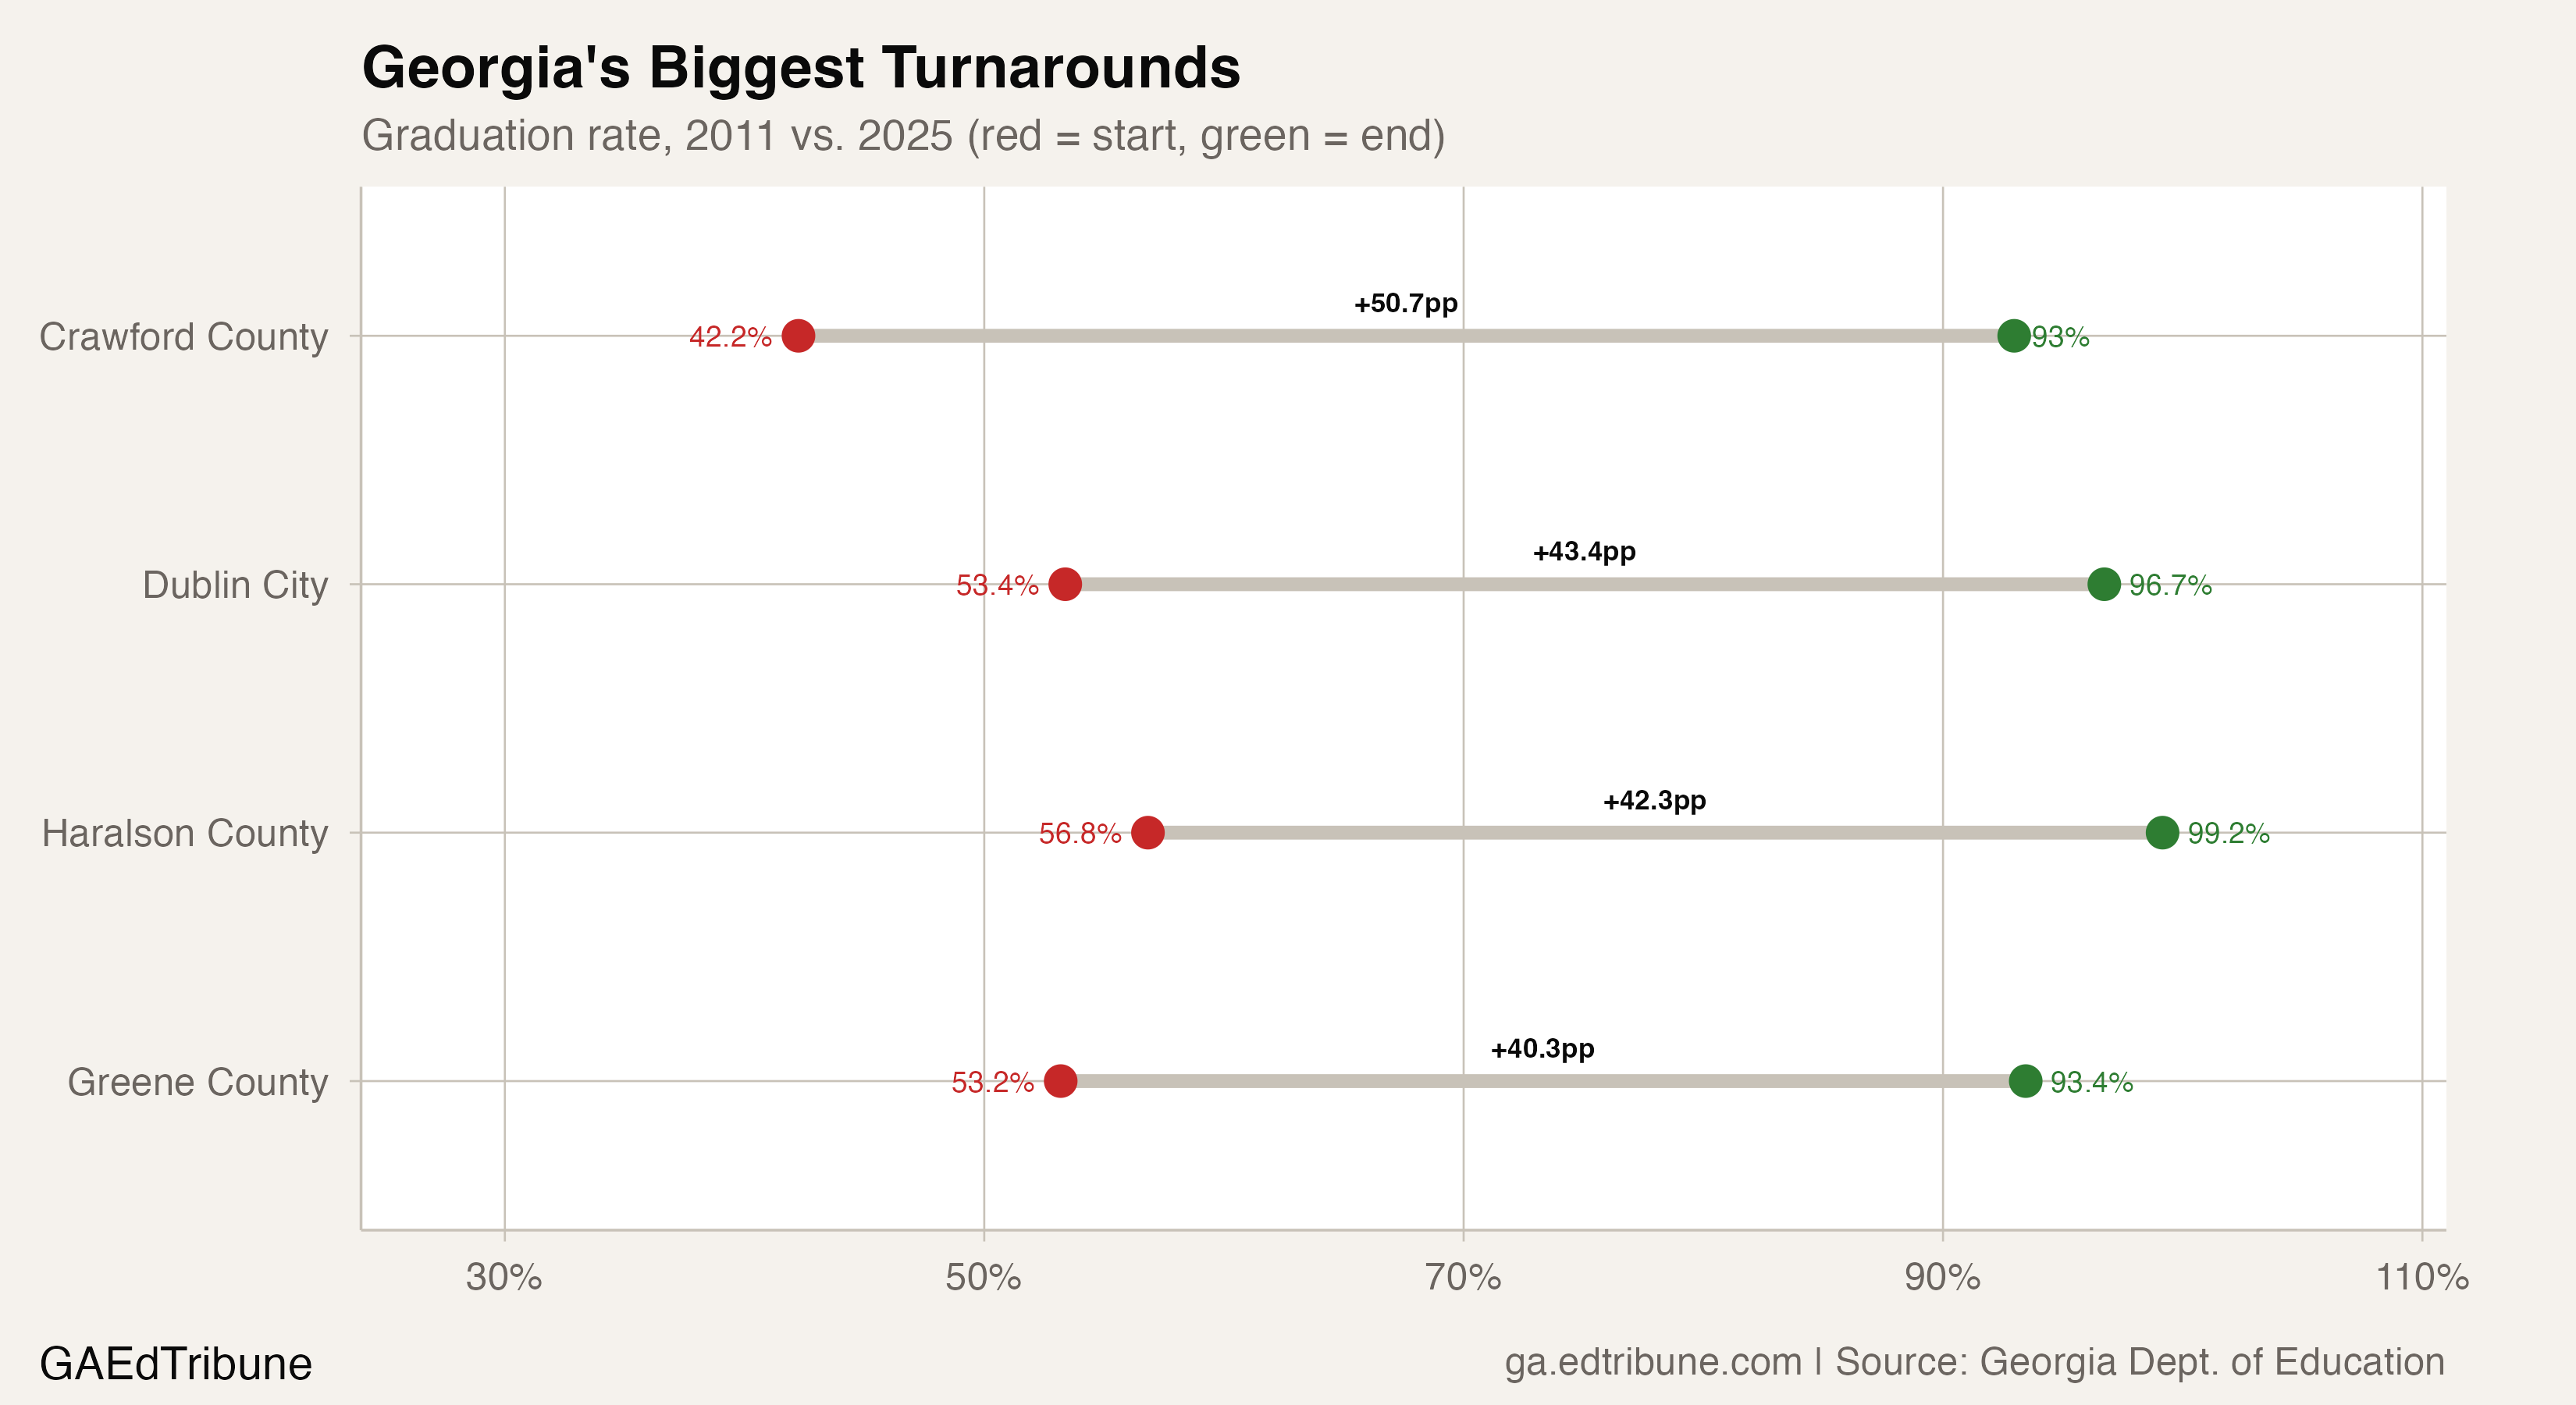
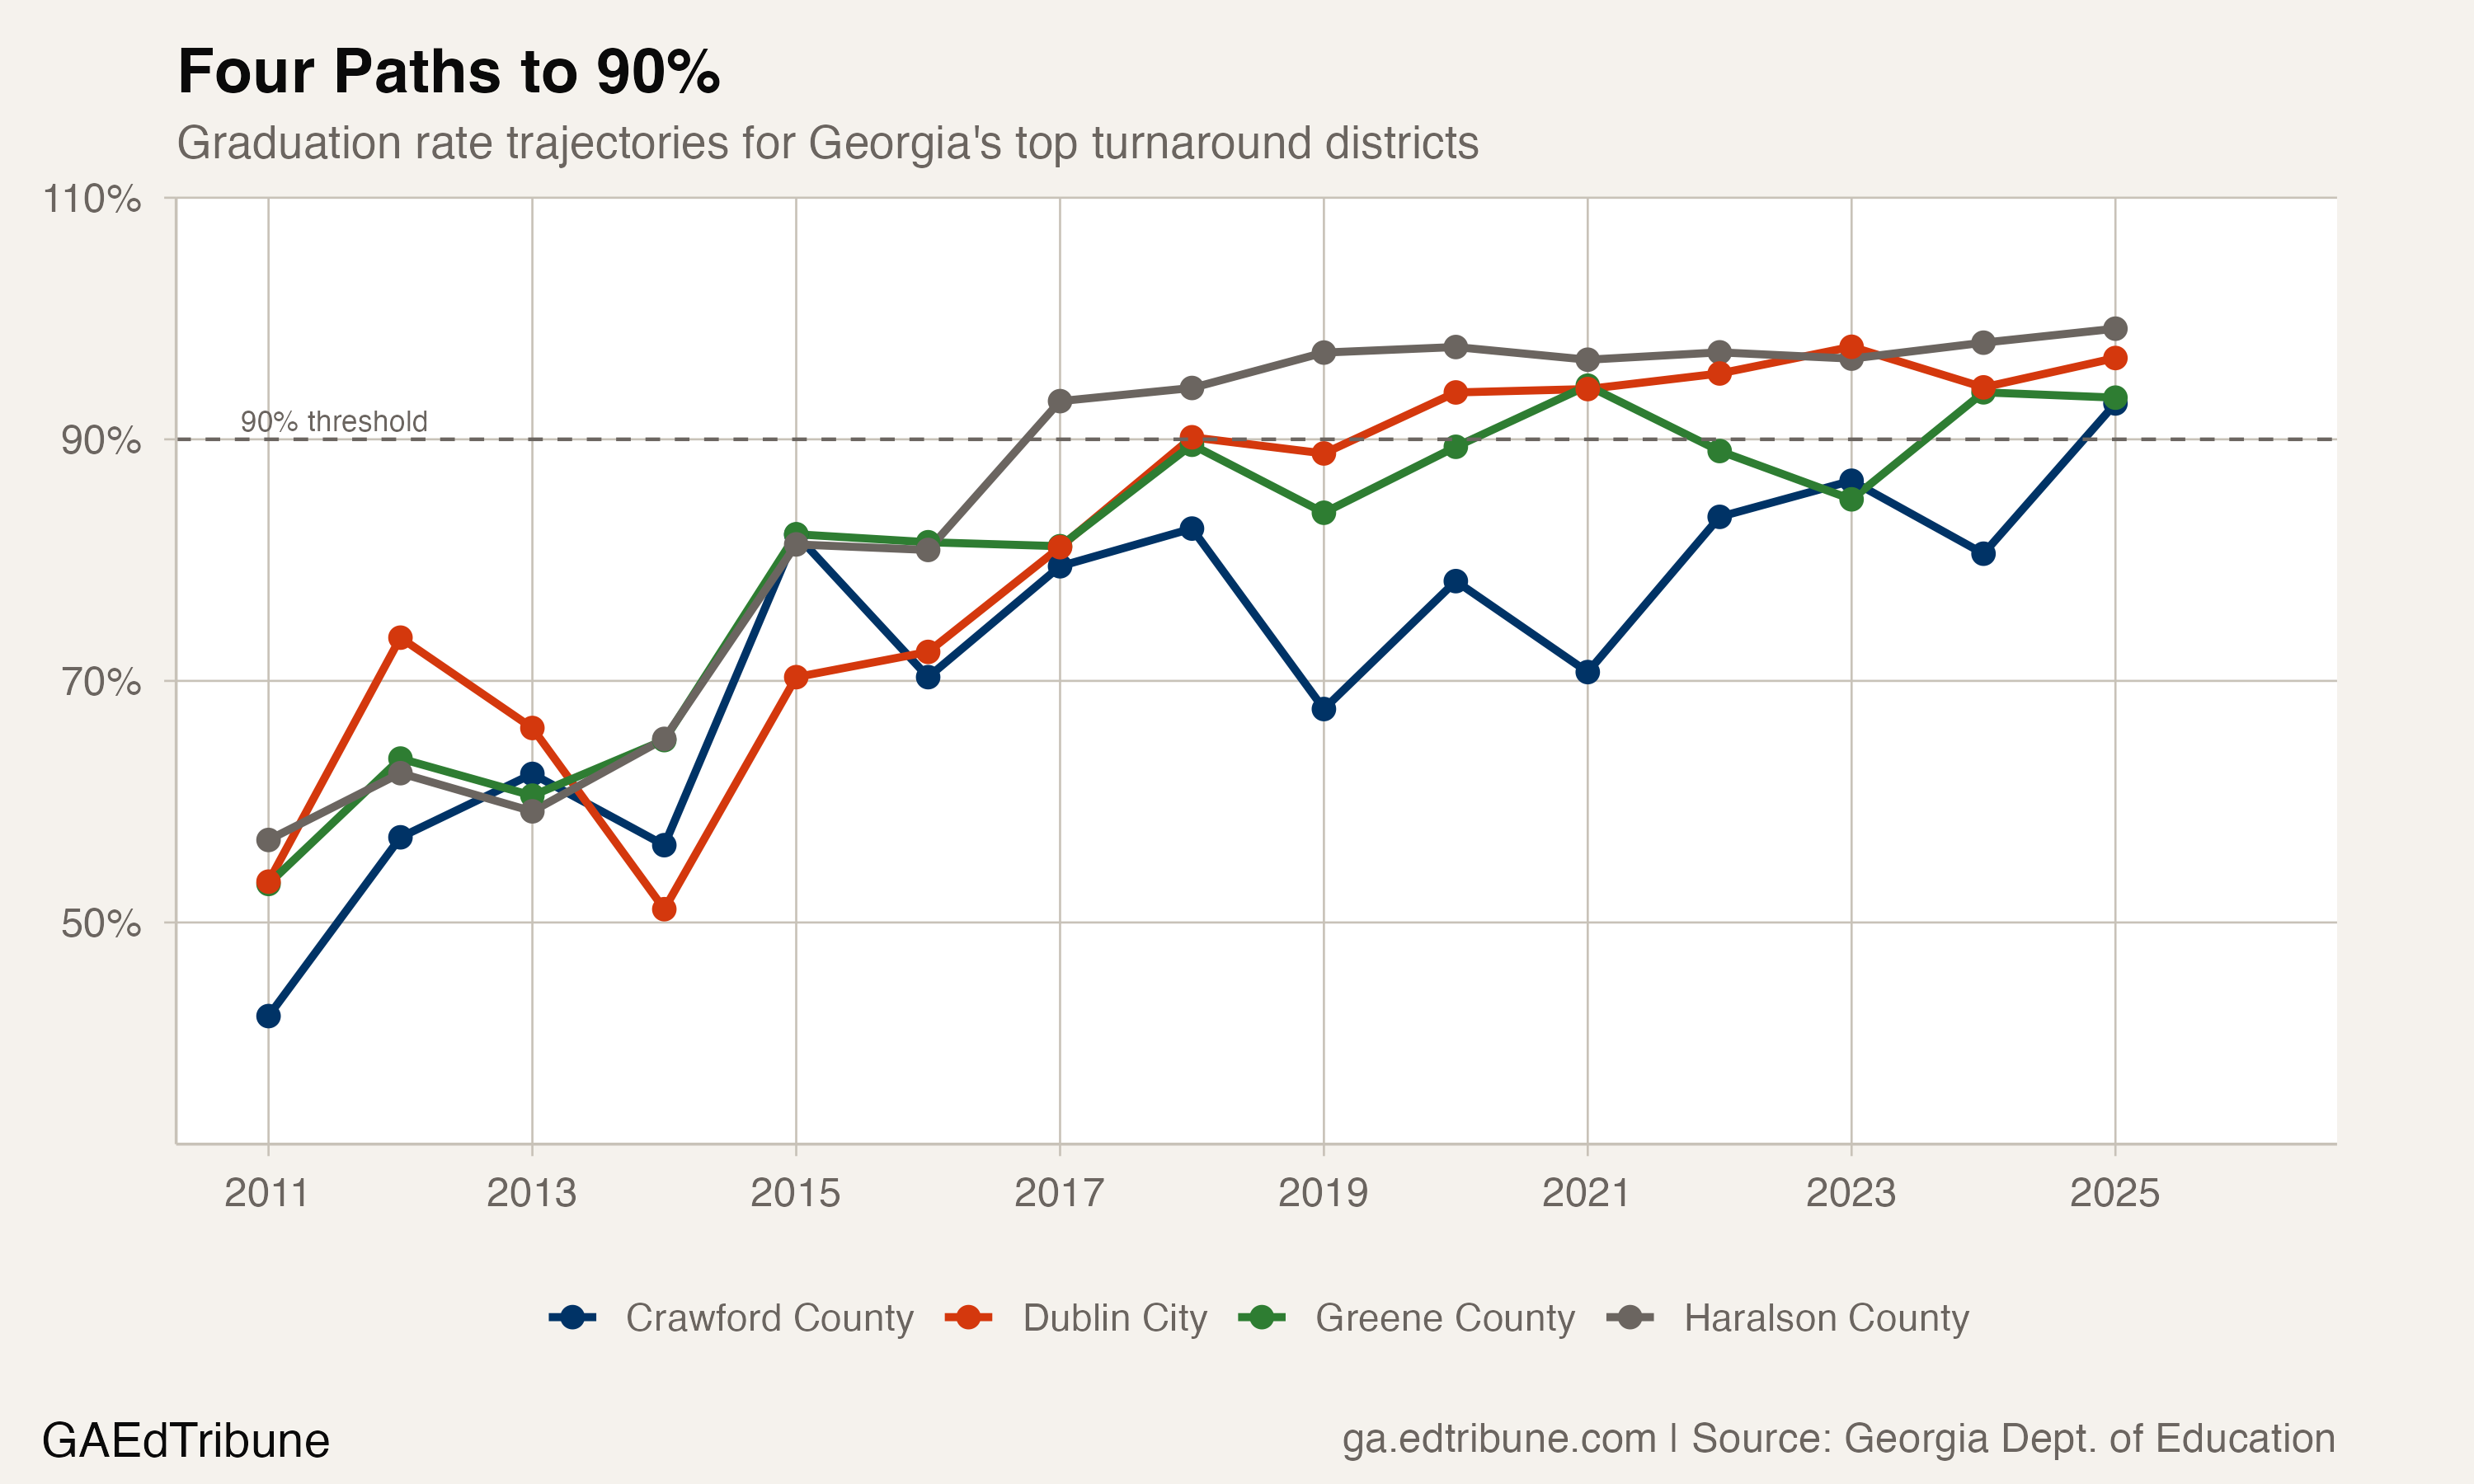
Dublin City↗ET, in Laurens County, climbed from 53.4% to 96.7%, a 43.4-point gain. Dublin, which earned Georgia's Charter System of the Year award in 2019, operates an International Baccalaureate program at Dublin High School, the only IB World School between Macon and Savannah. The district's trajectory was uneven, dipping to 51.1% in 2014 before a sustained ascent. By 2023 it reached 97.7%.
Haralson County↗ET, in northwest Georgia, rose from 56.8% to 99.2%, graduating all but two of its 237 seniors in 2025. Unlike Crawford or Dublin, Haralson's improvement was remarkably steady after 2015, never dipping below 93.2% once it crossed that threshold in 2017. The district's consistency, once it found a formula, held for nine consecutive years.
Greene County↗ET, east of Atlanta, moved from 53.2% to 93.4%, a 40.3-point gain. Greene's path was more jagged, including a retreat from 94.4% in 2021 to 85.0% in 2023 before recovering. Volatility in a cohort of 168 students is expected, but the overall arc held.
The 2015 question
Any discussion of Georgia graduation gains must account for the 2015 discontinuity. Statewide, the four-year adjusted cohort graduation rate jumped from 72.6% to 78.8% between 2014 and 2015. Rough Draft Atlanta reported that experts attributed the gains partly to improved tracking of student transfers, as "administrators became more adept at keeping records that showed their former students had landed at another school." The federal cohort calculation requires schools to confirm departing students reenrolled elsewhere; better recordkeeping allowed districts to more accurately remove transfers from their denominators.
Crawford's rate jumped 25.7 points in 2015, far exceeding the 6.2-point statewide bump. Haralson gained 16.1 points. Greene gained 17.0 points. Some of the turnaround, particularly in that single year, reflects better recordkeeping rather than better outcomes.
But the 2015 jump does not explain what happened after. Crawford was at 82.1% in 2015, fell back to 67.7% in 2019, and then climbed to 93.0% by 2025. The post-2015 gains, earned in the years when the methodology was stable, account for roughly 11 points of additional improvement. Haralson went from 81.3% in 2015 to 99.2% in 2025, an 18-point gain in the stable era. These districts did not merely benefit from a bookkeeping fix. They built on it.
What the statewide rise looks like from below
Georgia's overall graduation rate reached 87.2% in 2025, another all-time high, up 19.8 points since 2011. The 1.8-point single-year gain was the largest since the 2015 methodology shift.
The state now has 134 districts graduating at or above 90% and 60 at or above 95%. But the gains were not uniform. The districts that moved the most were overwhelmingly rural, small, and heavily African American or economically disadvantaged. The 26 districts that started below 60% in 2011 gained an average of 34.5 percentage points. The districts that started above 80% gained an average closer to 10.
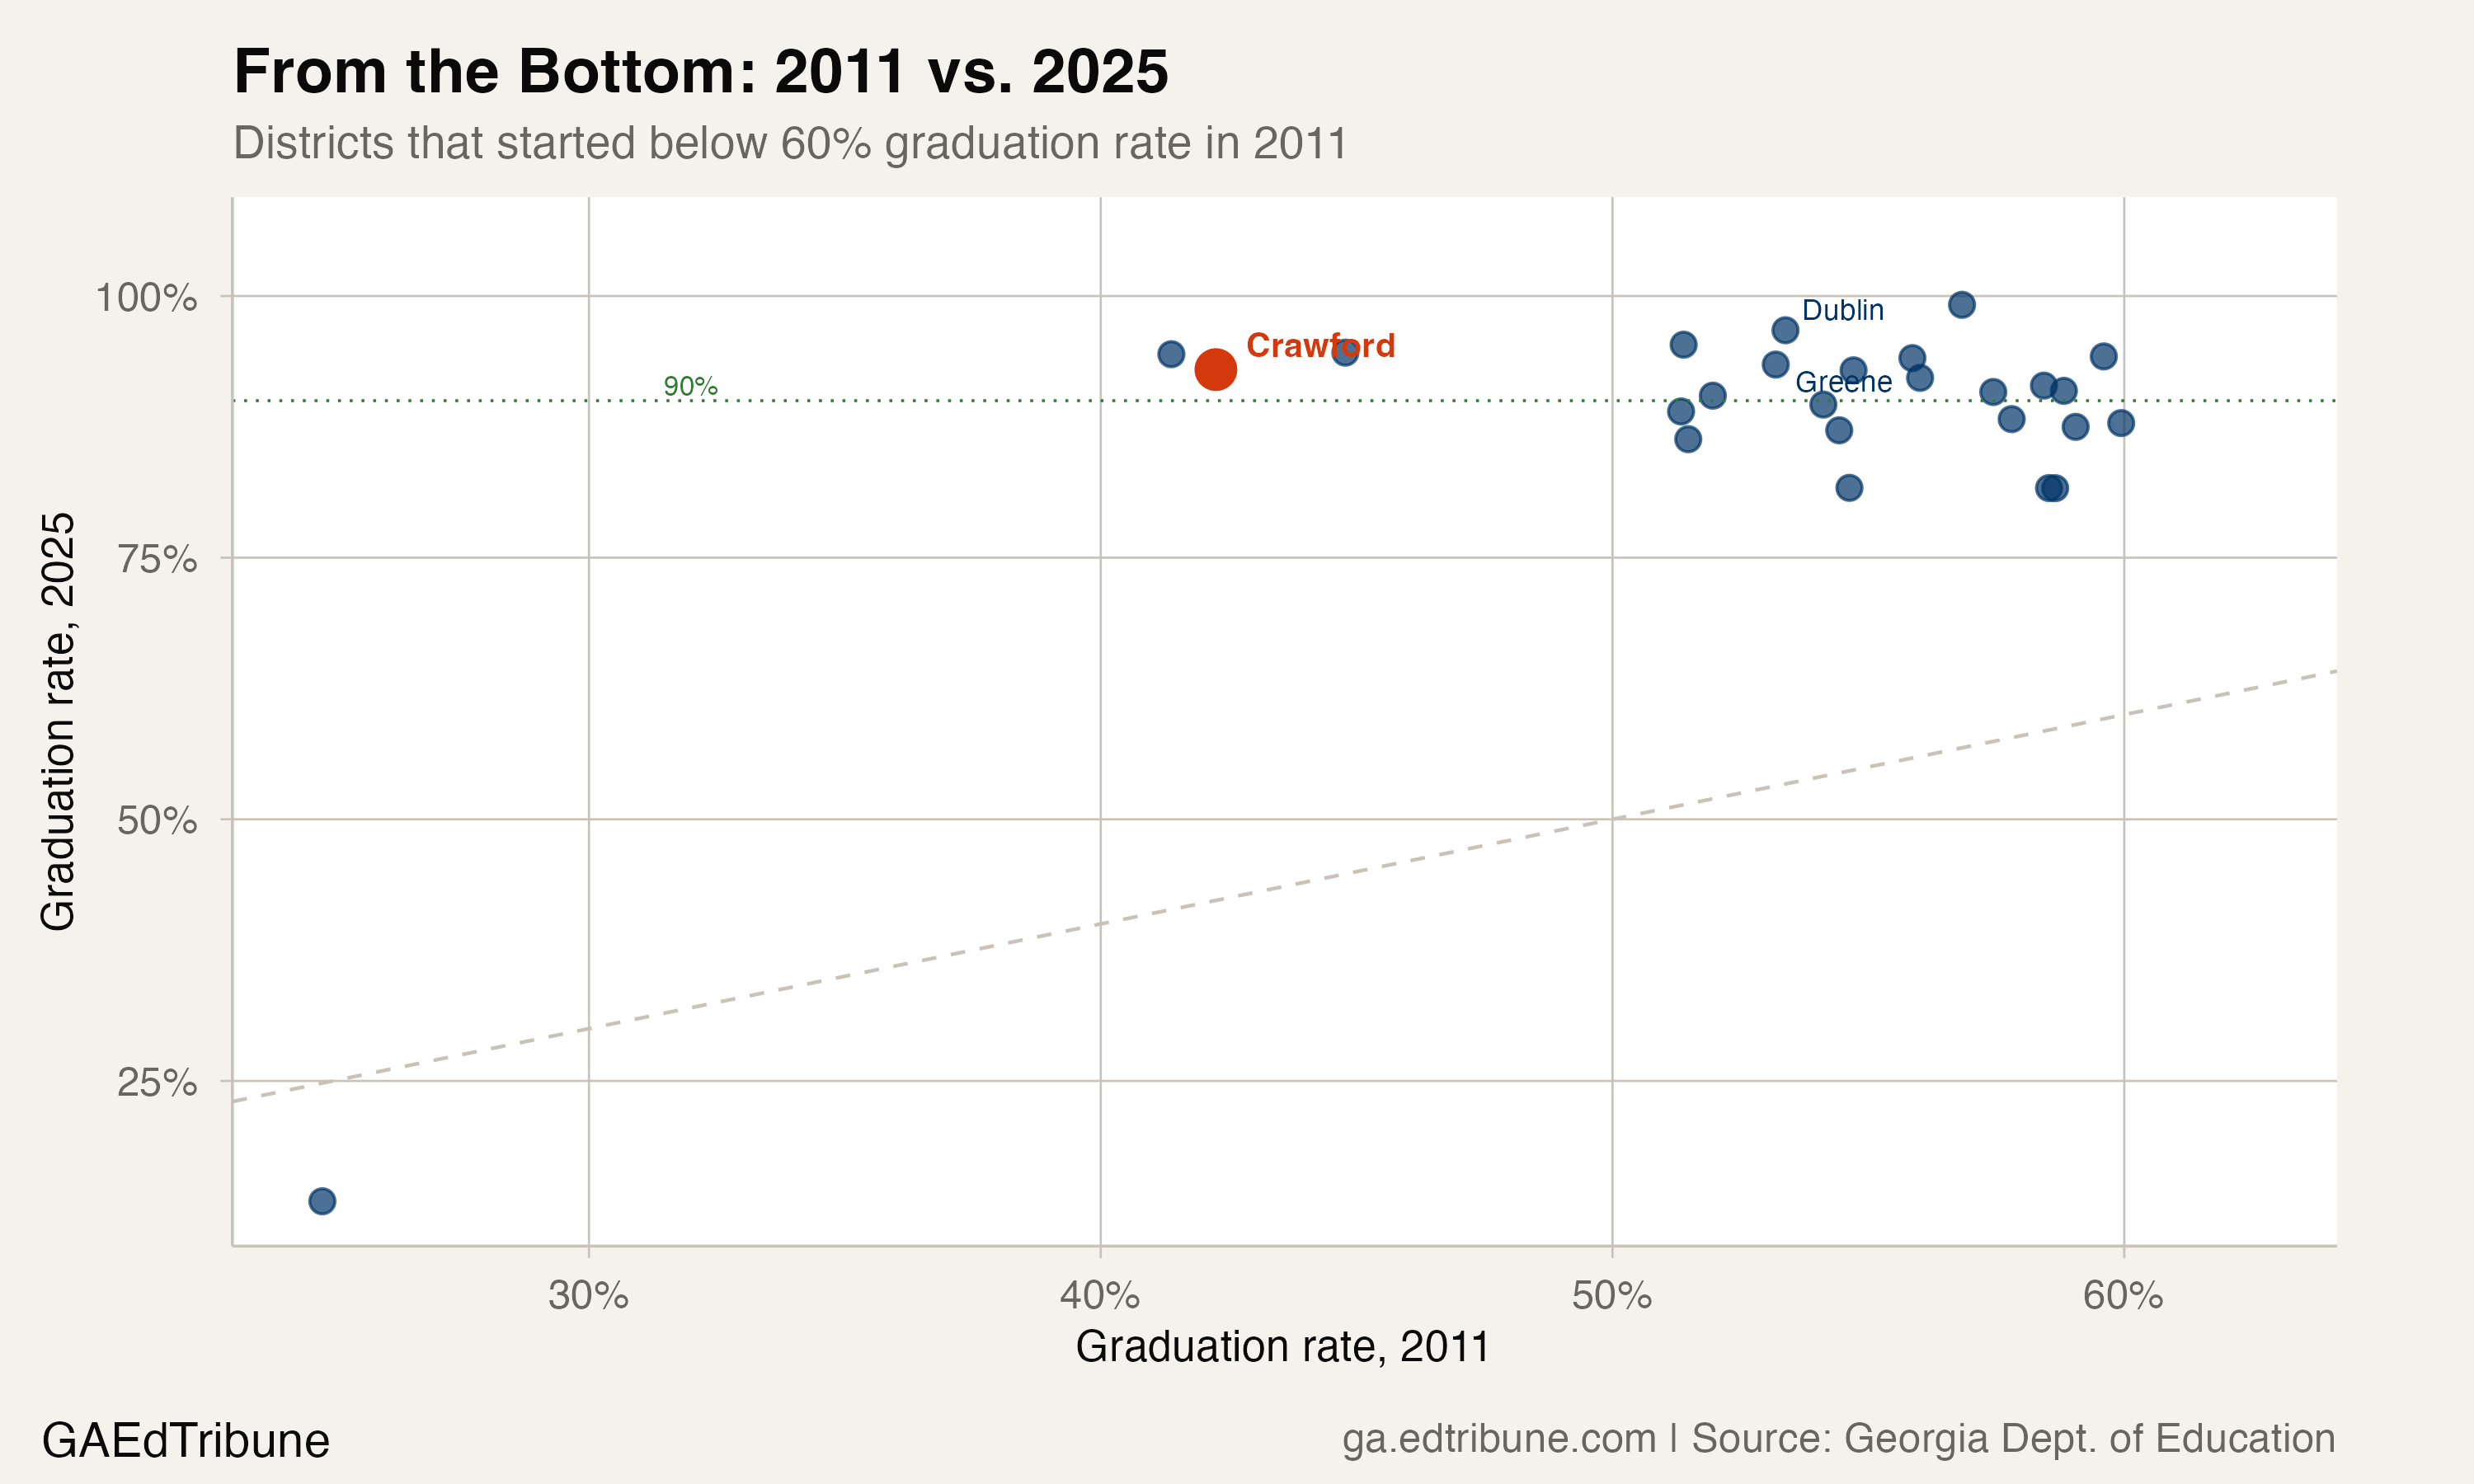
That convergence pattern is partly mathematical. A district at 90% cannot gain 50 points. But it also reflects targeted state investment. The Georgia Department of Education established the Office of Rural Education and Innovation in 2021, serving 115 local education agencies across rural Georgia, focused on eliminating non-academic obstacles to learning, expanding internet and device access, and building workforce development pipelines. Georgia's Rural Education Opportunity Fund, created in 2017 by the Georgia Foundation for Public Education, directed grant support to rural districts, and the Southern Regional Education Board partnered with rural Georgia districts including Burke, Emanuel, and Jefferson counties on networked improvement communities.
Whether these statewide initiatives specifically reached Crawford or Dublin or Haralson is not documented in any public reporting. The improvement happened across many rural districts simultaneously, which suggests systemic forces rather than one district's isolated heroism.
The gap Crawford closed
In 2011, Crawford County trailed the state average by 25.2 percentage points. The gap narrowed erratically: Crawford briefly exceeded the state average in 2015, fell back below it for most of the next seven years, then surged past it again in 2023 and 2025. In the most recent year, Crawford graduated at 93.0% against a state average of 87.2%, a 5.8-point margin.
The turnaround also had a racial dimension. In 2011, Crawford's Black students graduated at 37.8% on a cohort of 45. In 2025, all 33 Black students in the cohort graduated. White students improved from 44.2% to 89.5%. Both gains are substantial, but the Black graduation rate now exceeds the white rate by more than 10 points, a reversal from 2011 when it lagged by 6.4 points.
What the data cannot answer
Crawford's graduation rate improvement is verified and substantial. What the data does not reveal is the mechanism. A district that goes from graduating 42% of its students to 93% has fundamentally changed something about how it operates: what happens when a student falls behind in credits, who intervenes, how transfer documentation is handled, whether credit recovery is available, and how the ninth-to-tenth grade transition is managed.
Douglas County, which crossed 90% for the first time in 2025, credited on-campus Performance Learning Centers that provided early intervention for at-risk students. Pickens County attributed its gains to career planning conversations starting at the elementary level.
The proficiency gap is worth noting. Crawford County's students are graduating at 93%, but math proficiency sits at 20% and reading at 32%, both well below state averages of 39% and 40% respectively. This is a common tension nationally: a graduation rate measures completion, not mastery. The 119 students who graduated in 2025 earned their diplomas, but roughly three-quarters of them were not proficient on state assessments.
That tension does not diminish the turnaround. In 2011, 108 of 187 Crawford County students did not graduate on time. Many of them likely never came back. The district's achievement is that 119 of 128 now do. What those students learn along the way is a separate question, and one that Crawford's assessment scores suggest the district is still working to answer.
Detailed code that reproduces the analysis and figures in this article is available exclusively to EdTribune subscribers.
Discussion
Sign in to join the discussion.
Loading comments...