Correction: An earlier version placed the largest one-year change one year late and identified 2014 instead of 2013 as a decline year. The published series shows the jump from 2013 to 2014; it does not itself explain the cause. This version also notes the missing 2016 cohort denominators.
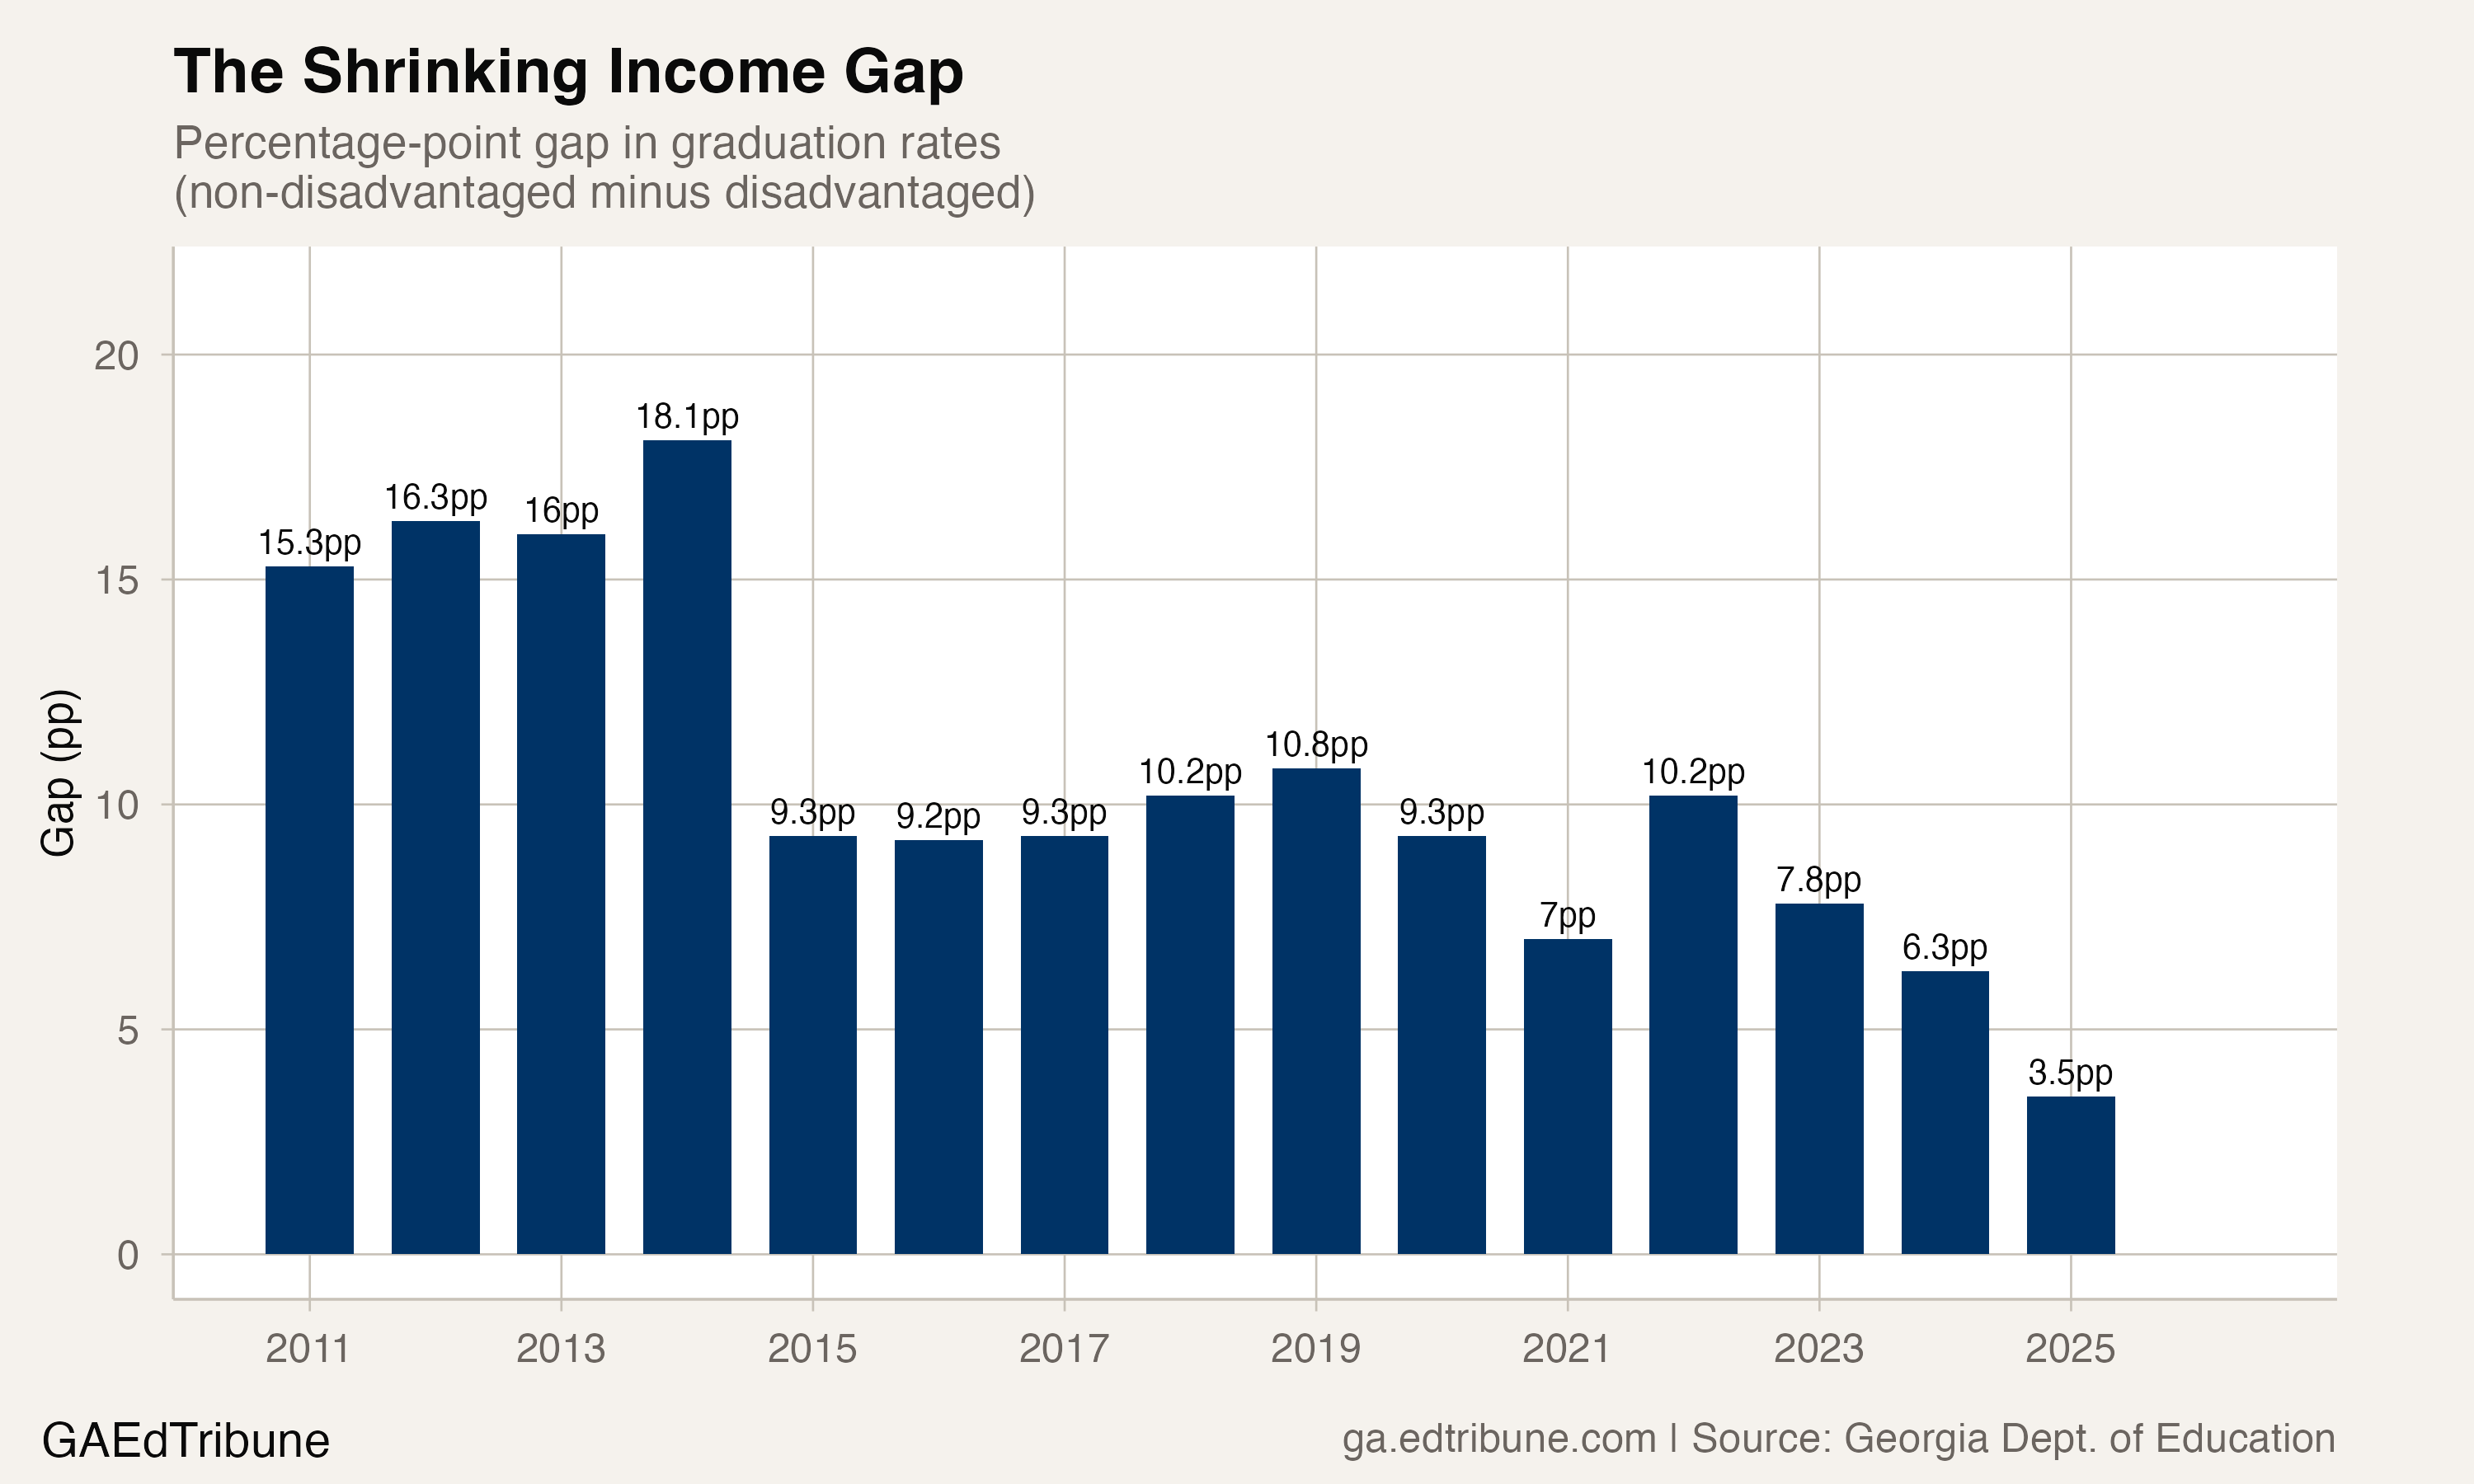
In 2011, a Georgia student classified as economically disadvantaged had a 59.4% chance of graduating on time. A student not classified as disadvantaged had a 74.6% chance. The gap between them, 15.3 percentage points, was wider than the white-Black graduation gap that same year.
By 2025, that gap had shrunk to 3.5 points. Students classified as economically disadvantaged graduated at 86.0%, nearly matching the 89.5% rate of peers not classified that way. The improvement for students in the disadvantaged group, 26.7 percentage points in 14 years, is one of the largest sustained gains for any subgroup in Georgia's graduation data.
But the number that should appear alongside every celebration: in 2011, 46.8% of the graduating cohort was classified as economically disadvantaged. In 2025, that figure was 66.0%. The definition of who counts as disadvantaged expanded twice, the comparison group shrank, and 88 Georgia districts now classify every graduating senior as economically disadvantaged, eliminating the comparison group entirely.
The gap narrowed. The question is how much of that narrowing reflects better outcomes for students in low-income households, and how much reflects a statistical artifact of reclassification.
Two lines converging, one definition shifting
The trajectory looks extraordinary on its face. From 2011 to 2025, the graduation rate for the economically disadvantaged group climbed every year except 2013 and 2022. The rate for students not classified as disadvantaged climbed too, from 74.6% to 89.5%, but at roughly half the pace: 14.9 points compared to 26.7.
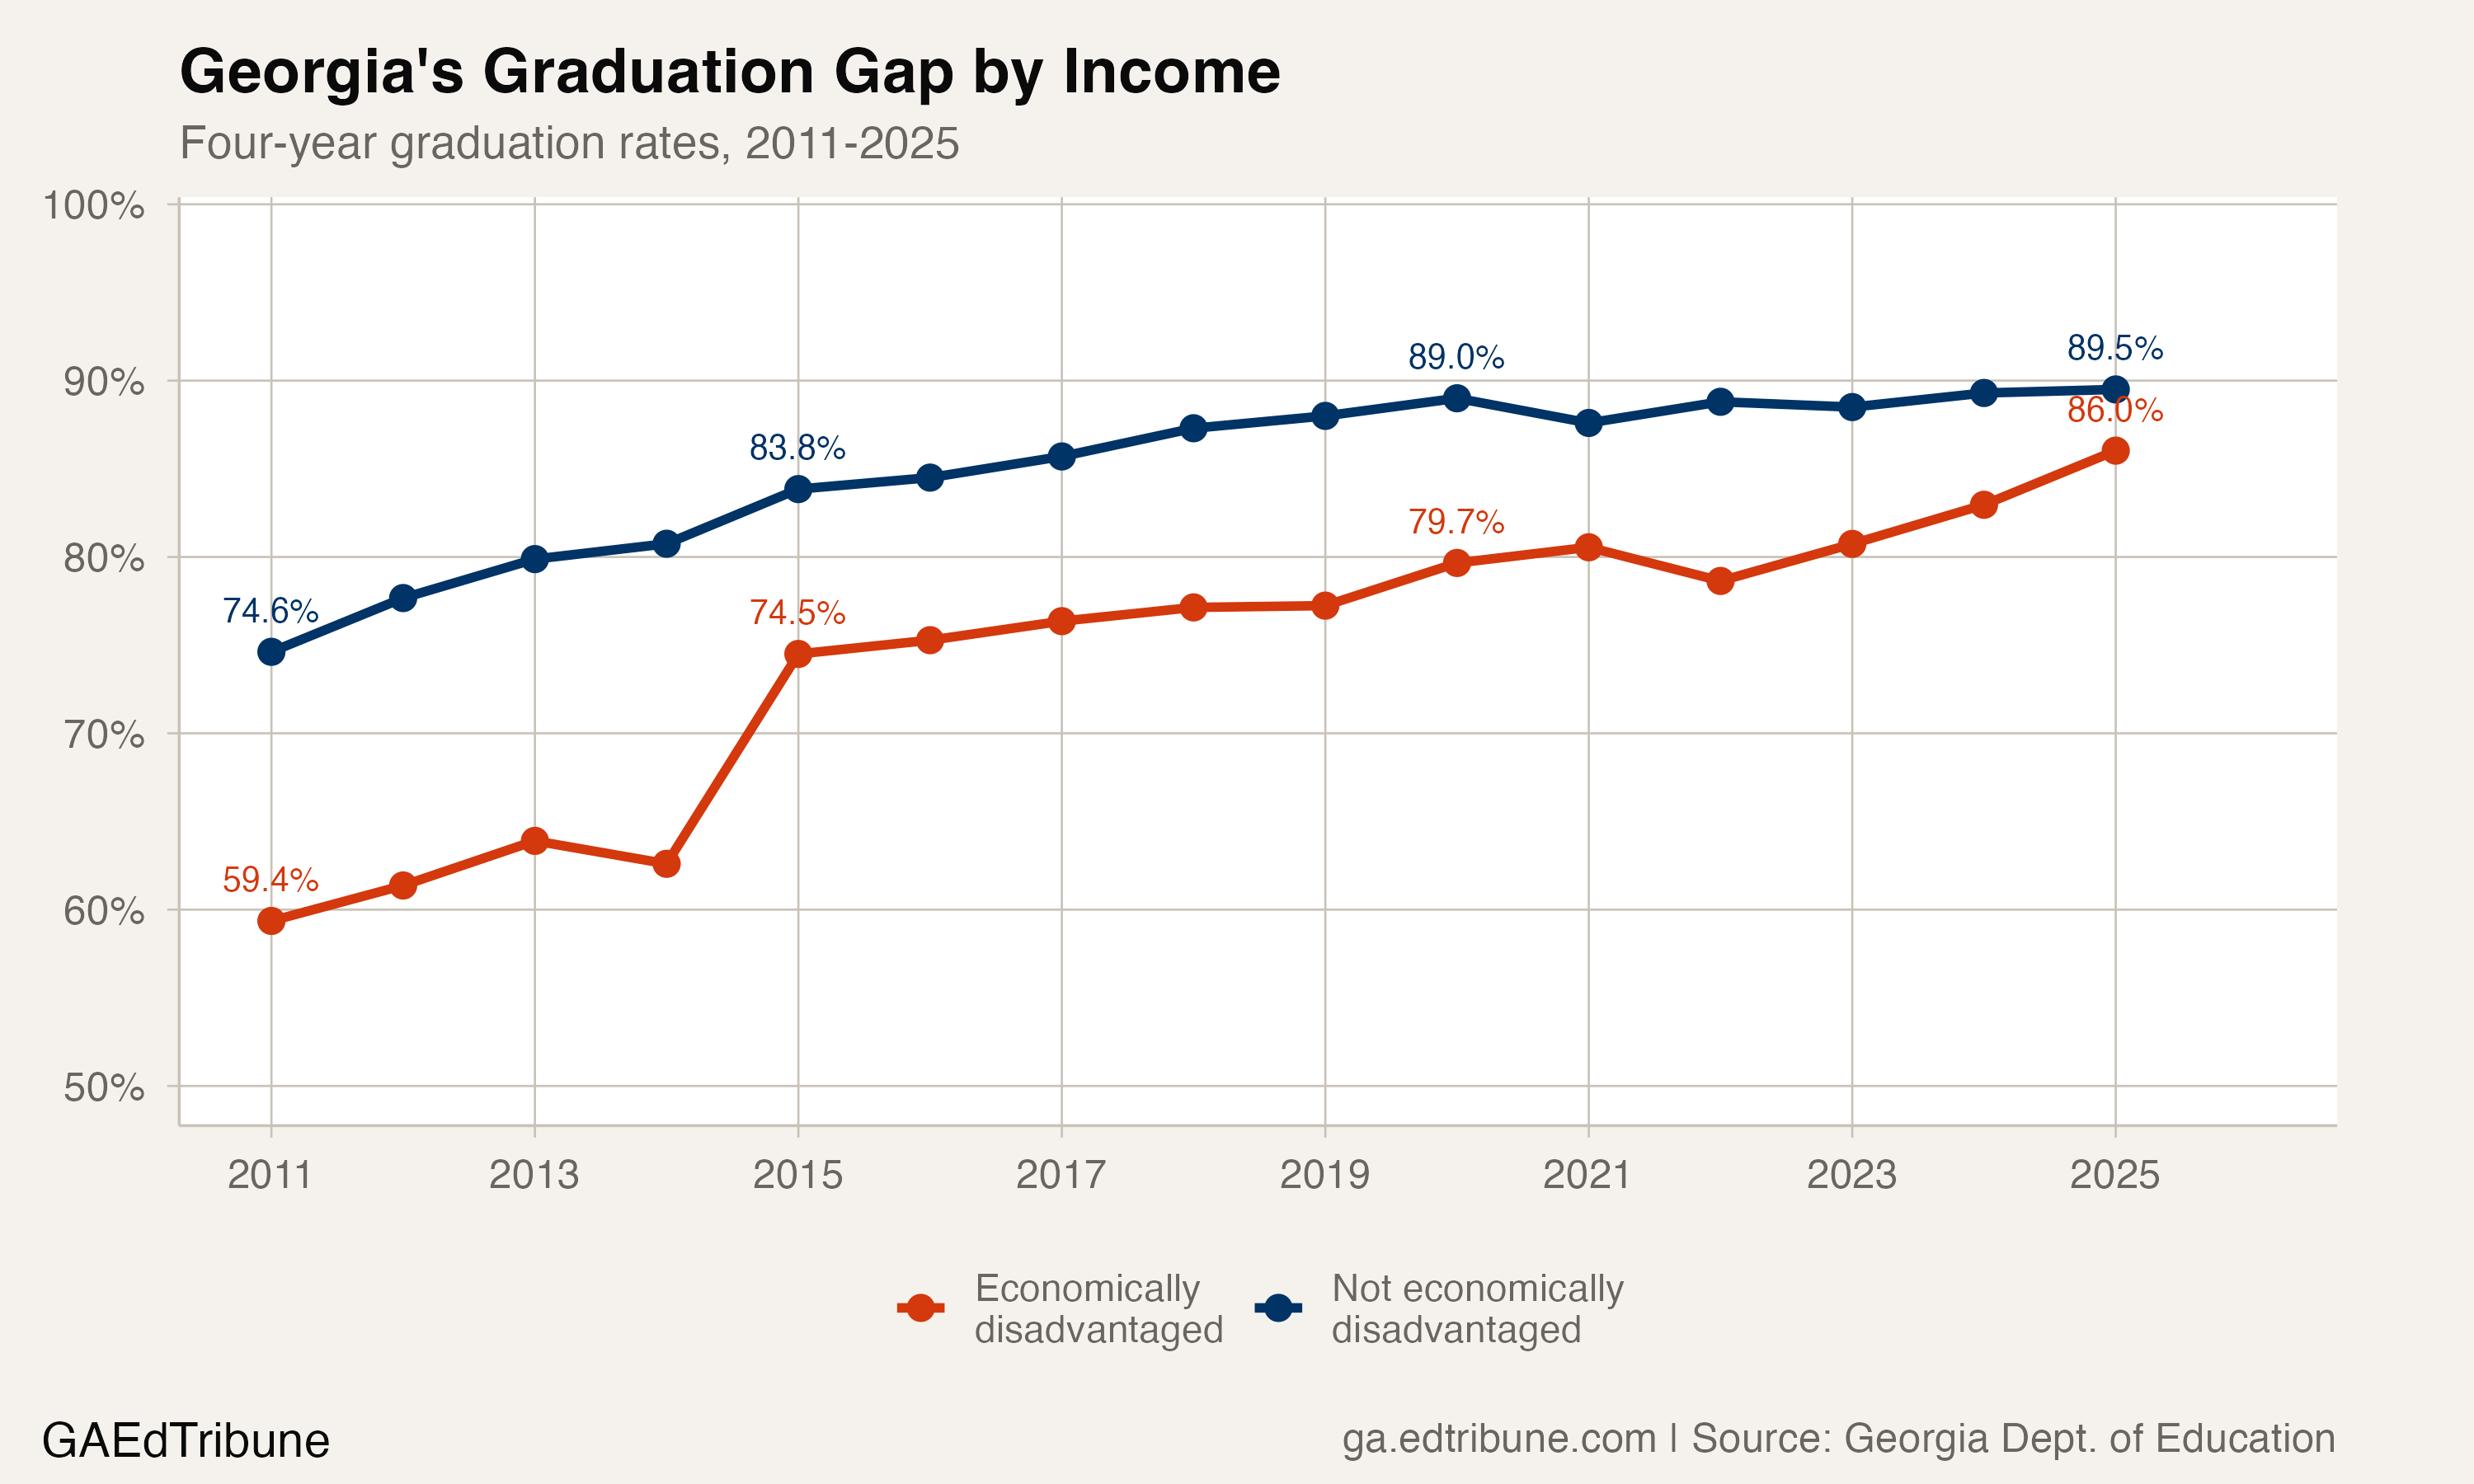
The sharpest single-year move came in 2014, when the disadvantaged-group rate jumped 11.9 points in one year, from 62.6% in 2013 to 74.5% in 2014. The gap dropped from 18.1 to 9.3 points over the same interval, nearly halving in a single year. The graduation file records the step-change but does not identify its cause.
After the 2014 step-change, the gap plateaued. It hovered between 9.2 and 10.8 points from 2014 through 2019, bouncing rather than converging. The real acceleration came after 2021: the gap fell from 7.0 points that year to 3.5 in 2025, a pace of roughly three-quarters of a percentage point per year.
The denominator problem
The most important chart in this story is not about graduation rates. It is about who gets counted.
In 2022, 46.6% of Georgia's graduating cohort was classified as economically disadvantaged, roughly in line with the 2011 baseline of 46.8%. By 2025, that share had surged to 66.0%, a 19.4-point increase in three years. Two-thirds of every graduating class is now labeled economically disadvantaged.
The source does not publish cohort denominators for 2016, so that year is omitted from the cohort-share line below.
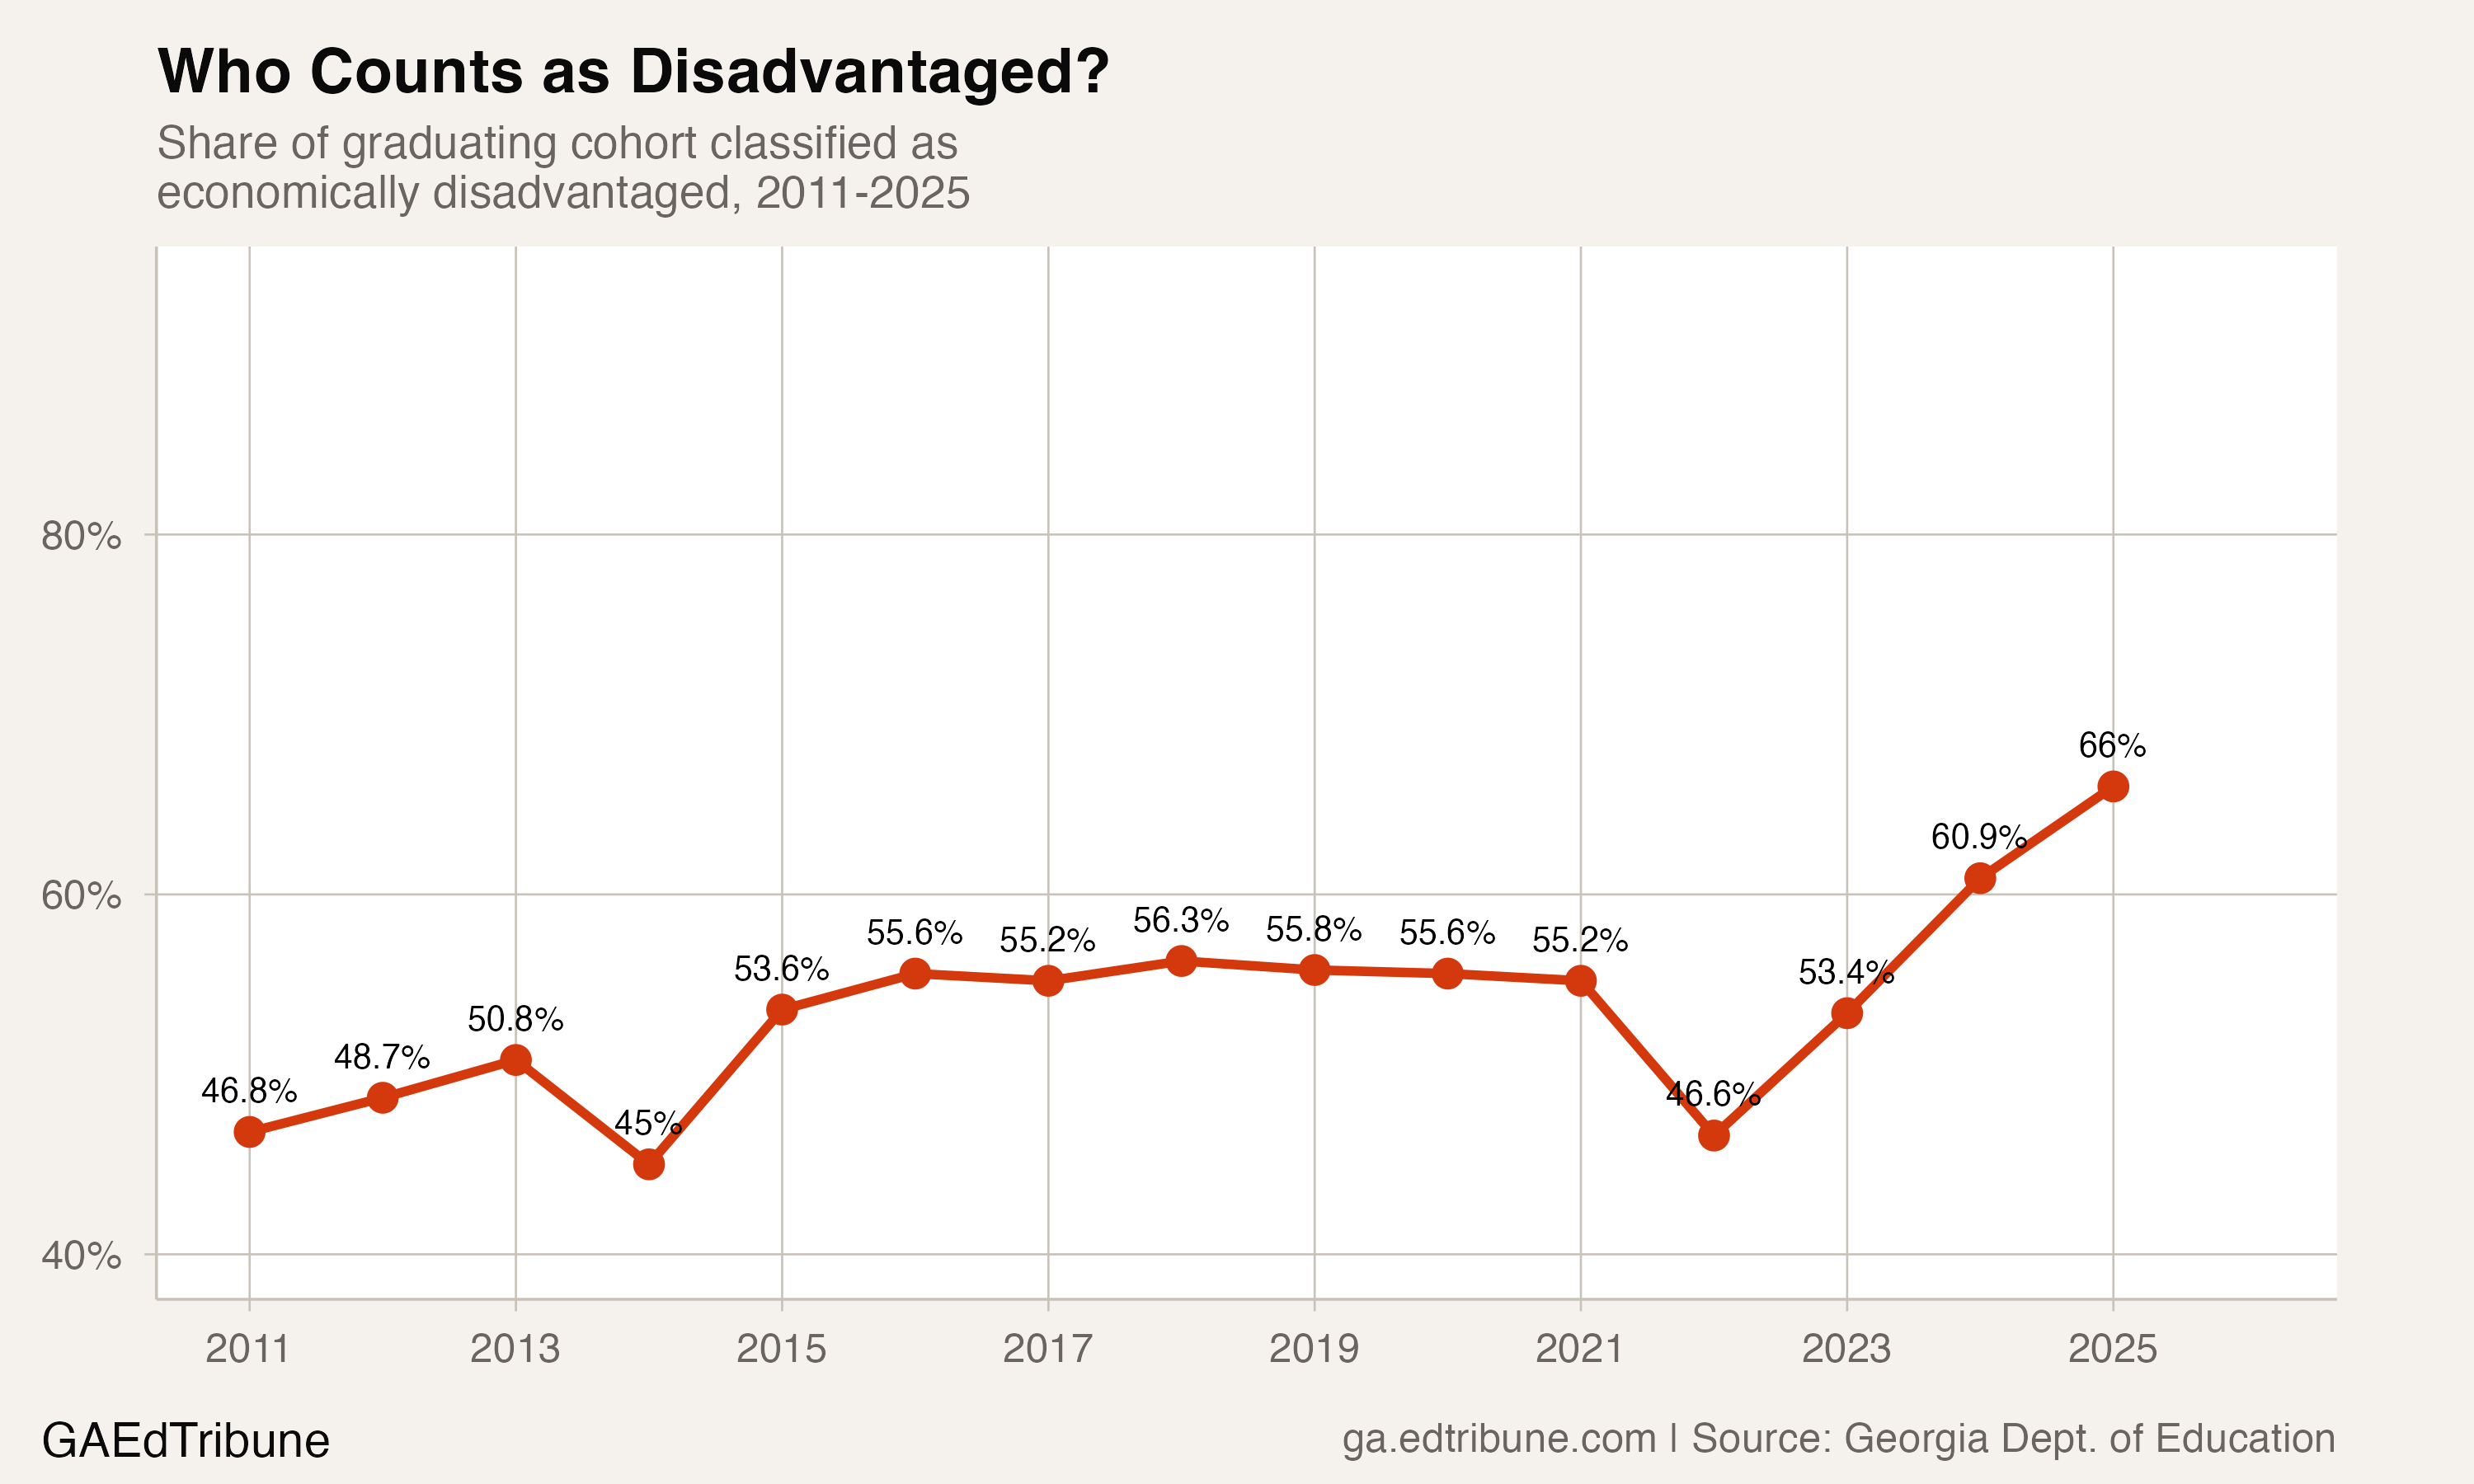
The acceleration has a specific cause. In 2023-24, Georgia joined the USDA's Medicaid Demonstration Project, which expanded direct certification to include families whose Medicaid income falls at or below free and reduced-price lunch thresholds. The Governor's Office of Student Achievement acknowledged that the resulting increase in economically disadvantaged percentages "reflects a policy change and not a sudden increase in student poverty."
Before the Medicaid expansion, Georgia classified students as economically disadvantaged through three channels: families receiving SNAP benefits, families receiving TANF benefits, and students who are homeless, in foster care, or migrant. The fourth channel, Medicaid income matching, cast a substantially wider net.
This matters for the gap calculation in a direct way. When the economically disadvantaged group expands to include students who were previously in the comparison group, both sides shift. Students who would have boosted the non-disadvantaged rate instead boost the disadvantaged rate. The gap narrows mechanically, without any individual student's outcome changing.
Where the comparison group disappeared
In Clayton County↗ET, every single member of the Class of 2025, all 4,131 seniors, was classified as economically disadvantaged. The comparison cohort was zero. There is no gap to measure because there is no comparison group.
Clayton is not an outlier. Across 234 Georgia districts reporting graduation data, 88 classified all of their graduating cohort as economically disadvantaged in 2025. Another 43 classified nine in ten or more. The median district-level economically disadvantaged share was 99.1%.
Only 36 districts, fewer than one in six, classified less than half their seniors as economically disadvantaged. These districts, concentrated in suburban Atlanta and north Georgia, are the only ones where the comparison group is large enough to be statistically meaningful.
The statewide 3.5-point gap is not a comparison between students from low-income and affluent households across Georgia. It is a comparison between the 66% of students classified as disadvantaged, a group that now includes families with modest Medicaid-qualifying incomes alongside those in deep poverty, and the 34% who remain unclassified, overwhelmingly concentrated in the state's wealthiest districts.
What the district data reveals
Among the 64 districts large enough to report both subgroups, 17 now show students classified as economically disadvantaged graduating at the same or higher rate than peers not classified that way. Some of these reversals are enormous: in Rockdale County↗ET, the disadvantaged-group rate is 92.1% while the non-disadvantaged-group rate is 26.4%, a 65.7-point gap in favor of the disadvantaged group. Whitfield County↗ET shows a similar pattern: 93.3% versus 32.4%.
These numbers do not mean students from low-income households massively outperform peers from wealthier households. They mean the non-disadvantaged group in these districts has shrunk to a handful of students, often fewer than 30, making the rate unstable and uninterpretable. When virtually every senior in a district is classified as disadvantaged, the tiny remainder is a statistical rounding error.
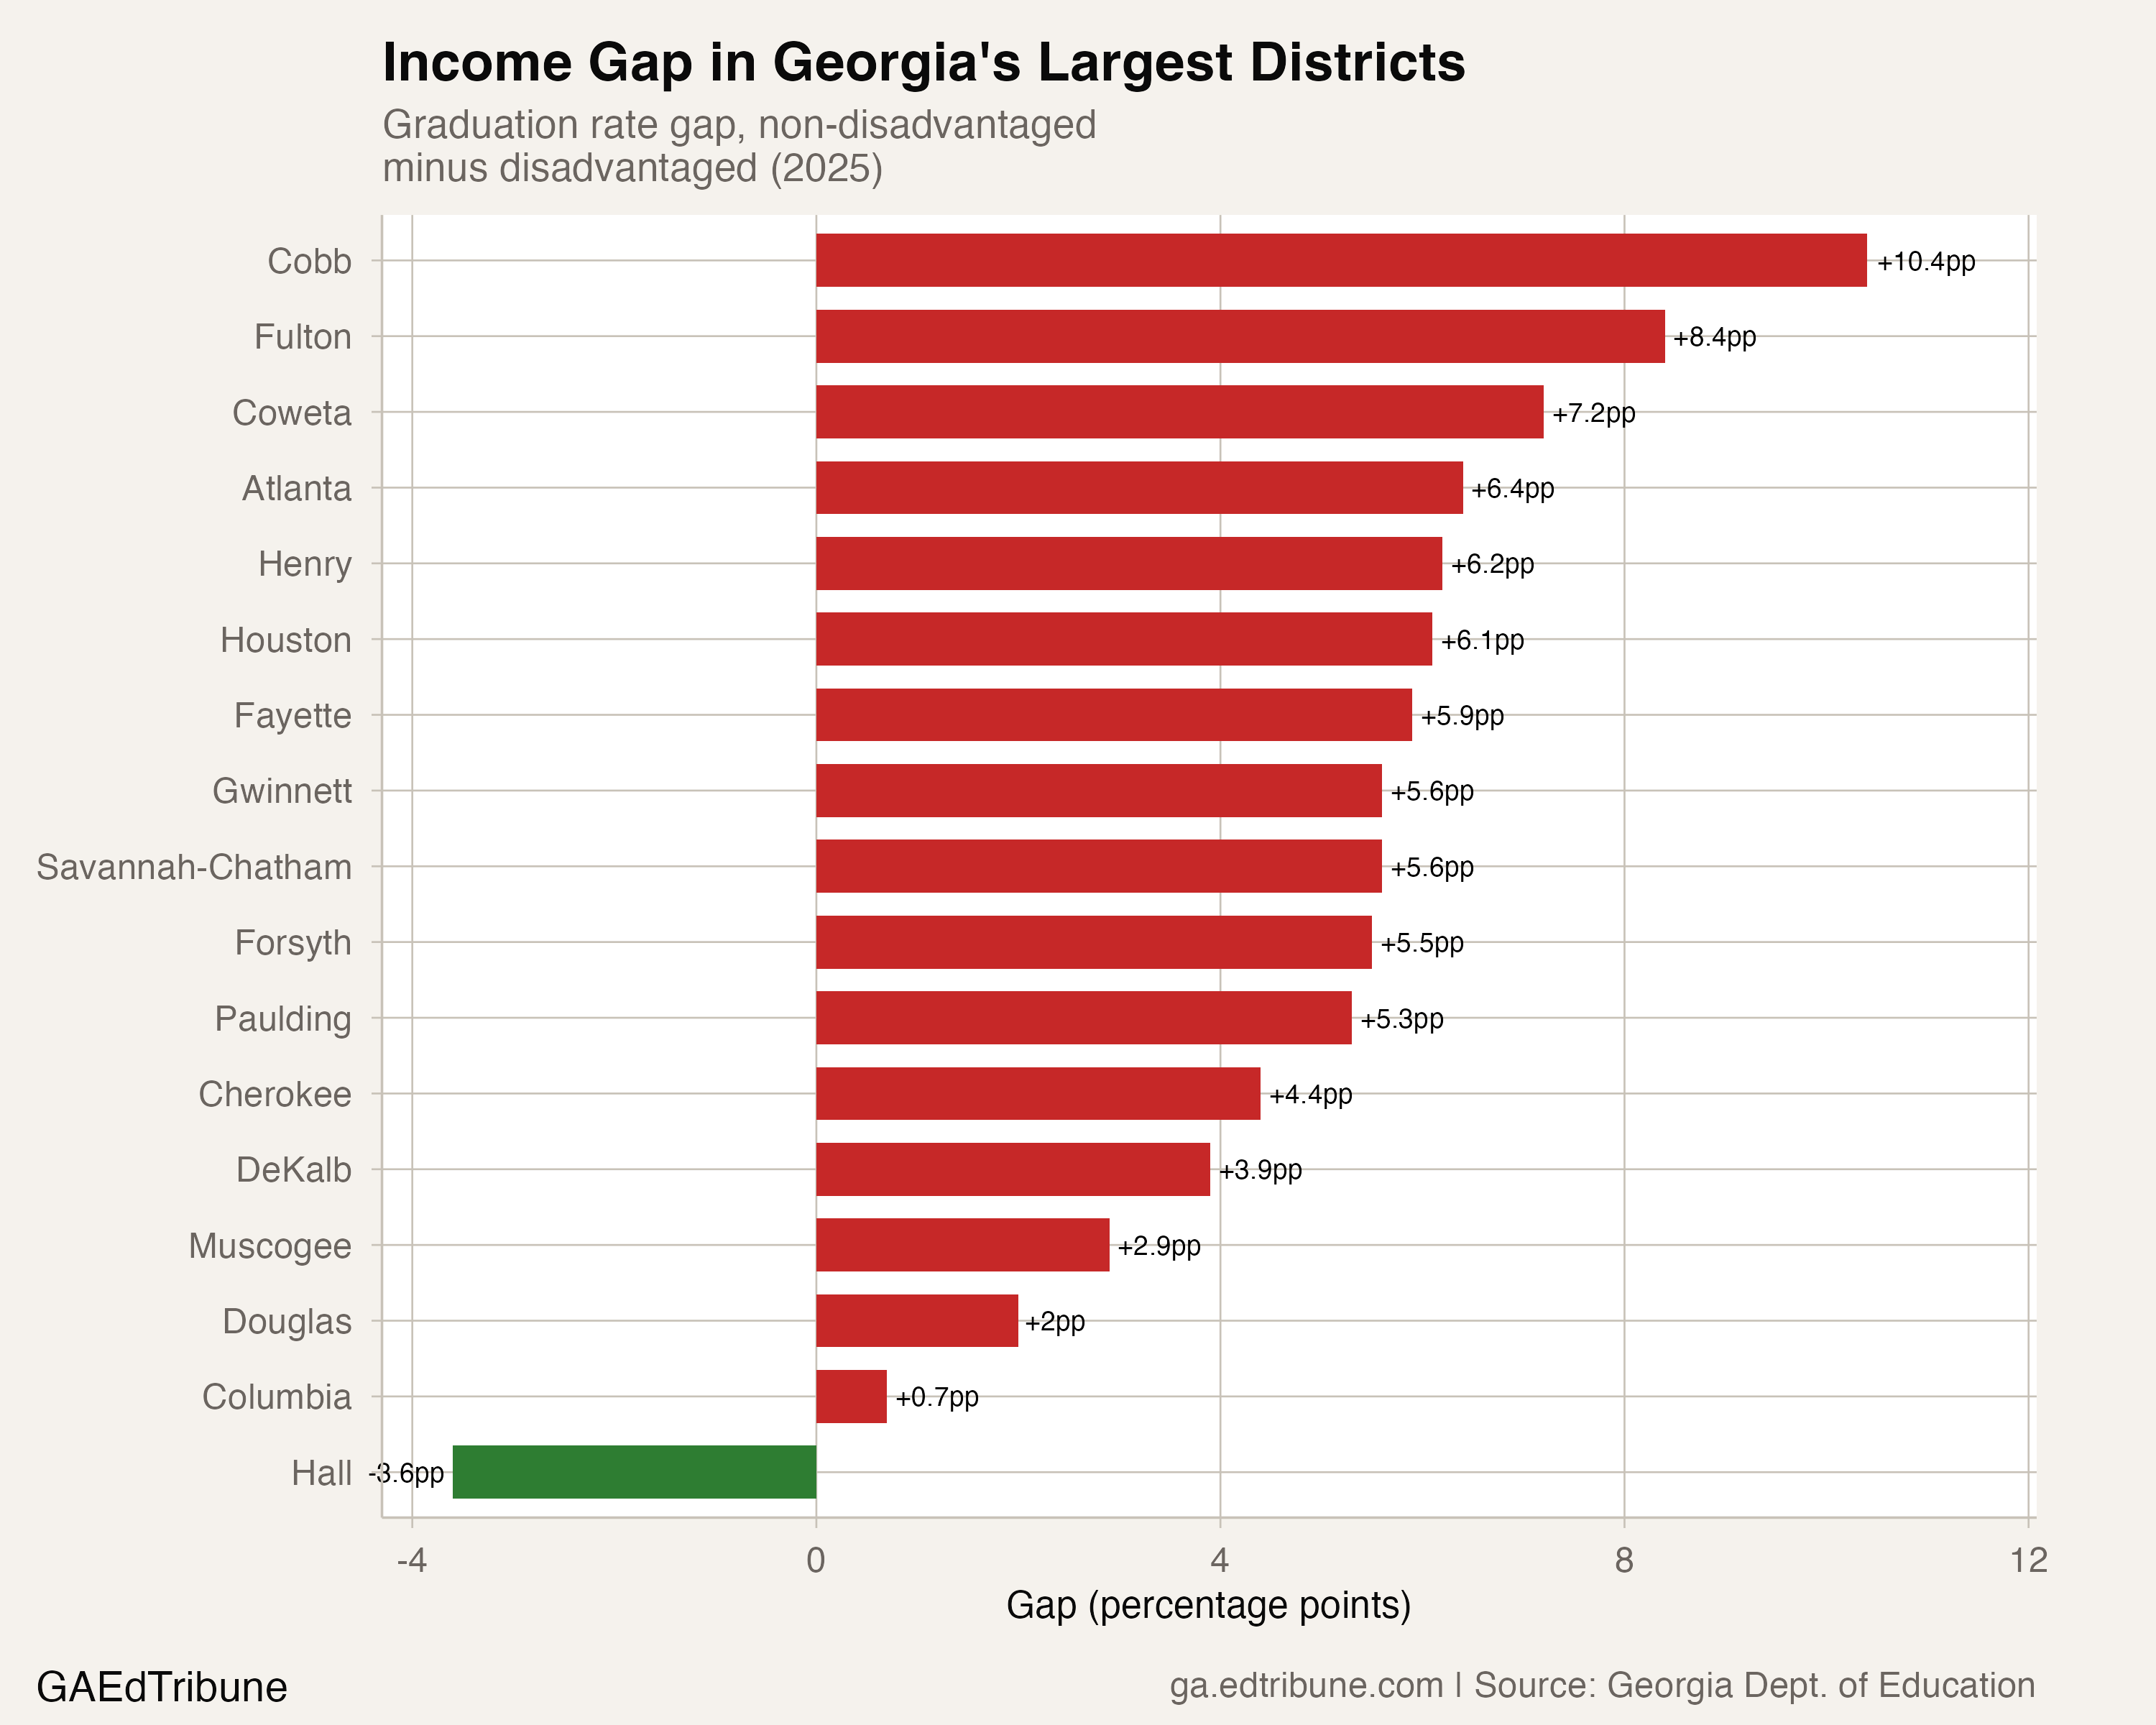
In Georgia's largest districts, where the comparison groups remain meaningful, the gap persists. Cobb County↗ET shows a 10.4-point gap, with the non-disadvantaged group at 94.3% and the disadvantaged group at 83.9%. Fulton County's gap is 8.4 points. These are districts where fewer than half of seniors are classified as disadvantaged, making the comparison credible.
Cobb's gap is notable for another reason. In 2011, the district reported an astonishing 71.2-point gap, driven by a disadvantaged-group graduation rate of just 7.9%, a figure almost certainly reflecting a data reporting anomaly rather than actual outcomes. By 2025, Cobb's disadvantaged-group rate had climbed to 83.9%. Setting aside the 2011 outlier, the improvement is real: Cobb's graduation rates rose across all subgroups in 2025, with the disadvantaged group gaining alongside peers.
Real improvement, layered onto reclassification
The reclassification story is real. But so is the improvement.
Georgia's overall graduation rate climbed from 67.5% in 2011 to 87.2% in 2025. The gap between the "all students" rate and the economically disadvantaged rate shrank from 8.1 points to 1.2 points. Even accounting for classification expansion, the disadvantaged group gained 26.7 points over a period when the overall rate gained 19.8, a compression that cannot be entirely explained by expanding the denominator.
State Superintendent Richard Woods described the 2025 results by noting that "more Georgia students are graduating than ever before, and they're doing so prepared to pursue futures full of opportunity." Douglas County↗ET, which jumped 4 points to 90.7%, credited early identification of students at risk of not graduating and on-campus Performance Learning Centers. Clayton County, where the overall rate climbed 3.3 points to 86.3%, pointed to expanded credit recovery with satellite sites and mentor pairings.
Credit recovery, the practice of letting students retake failed courses, is the mechanism most frequently cited by districts reporting large gains. It is also the mechanism most scrutinized by researchers who study graduation rate validity. A Brookings Institution analysis of the national graduation-rate surge concluded that the rise "likely reflects a real increase in human capital as well as some strategic behavior," noting that credit recovery alone could not explain the gains but that some degree of accountability-driven gaming was present.
Georgia's own data suggests the tension. The 87.2% graduation rate is an all-time high. Whether the preparation behind that diploma has kept pace is a question the graduation rate alone cannot answer.
What this gap no longer measures
The 3.5-point income gap in Georgia's graduation data reflects three overlapping features of the series: genuine improvement in outcomes for students from low-income households, a sharp 2014 step-change whose cause is not identified in the graduation file, and a post-2022 classification expansion that redrew the boundary between the groups being compared.
No single number can separate these forces. What the data can say is that a Georgia student classified as economically disadvantaged in 2025 graduates at 86.0%, a rate that would have been exceptional for any subgroup in 2011. That is meaningful regardless of how the classification boundary has moved.
What the data cannot say is whether the income-based graduation gap in Georgia is actually 3.5 points. When 88 districts have no comparison group, when the disadvantaged share has grown by 19.4 points in three years, and when the remaining non-disadvantaged students are concentrated in the wealthiest corners of the state, the gap statistic has become a measure of classification policy as much as a measure of equity.
The next question for Georgia is whether the state will adopt alternative poverty metrics, as the Governor's Office of Student Achievement has discussed since at least 2015, to restore a comparison that the current system can no longer meaningfully provide.
Detailed code that reproduces the analysis and figures in this article is available exclusively to EdTribune subscribers.
Discussion
Sign in to join the discussion.
Loading comments...