In Bibb County↗ET, a school district of about 23,000 students in central Georgia, 30.4% of students who are economically disadvantaged were chronically absent last year. For their non-disadvantaged peers in the same district, the rate was 0.2%, a figure likely driven by a very small comparison group in a district where the vast majority of students qualify as economically disadvantaged. That 30-point spread is an extreme case, but the pattern it illustrates runs through every corner of the state: economic status is the single strongest predictor of whether a Georgia student shows up to school.
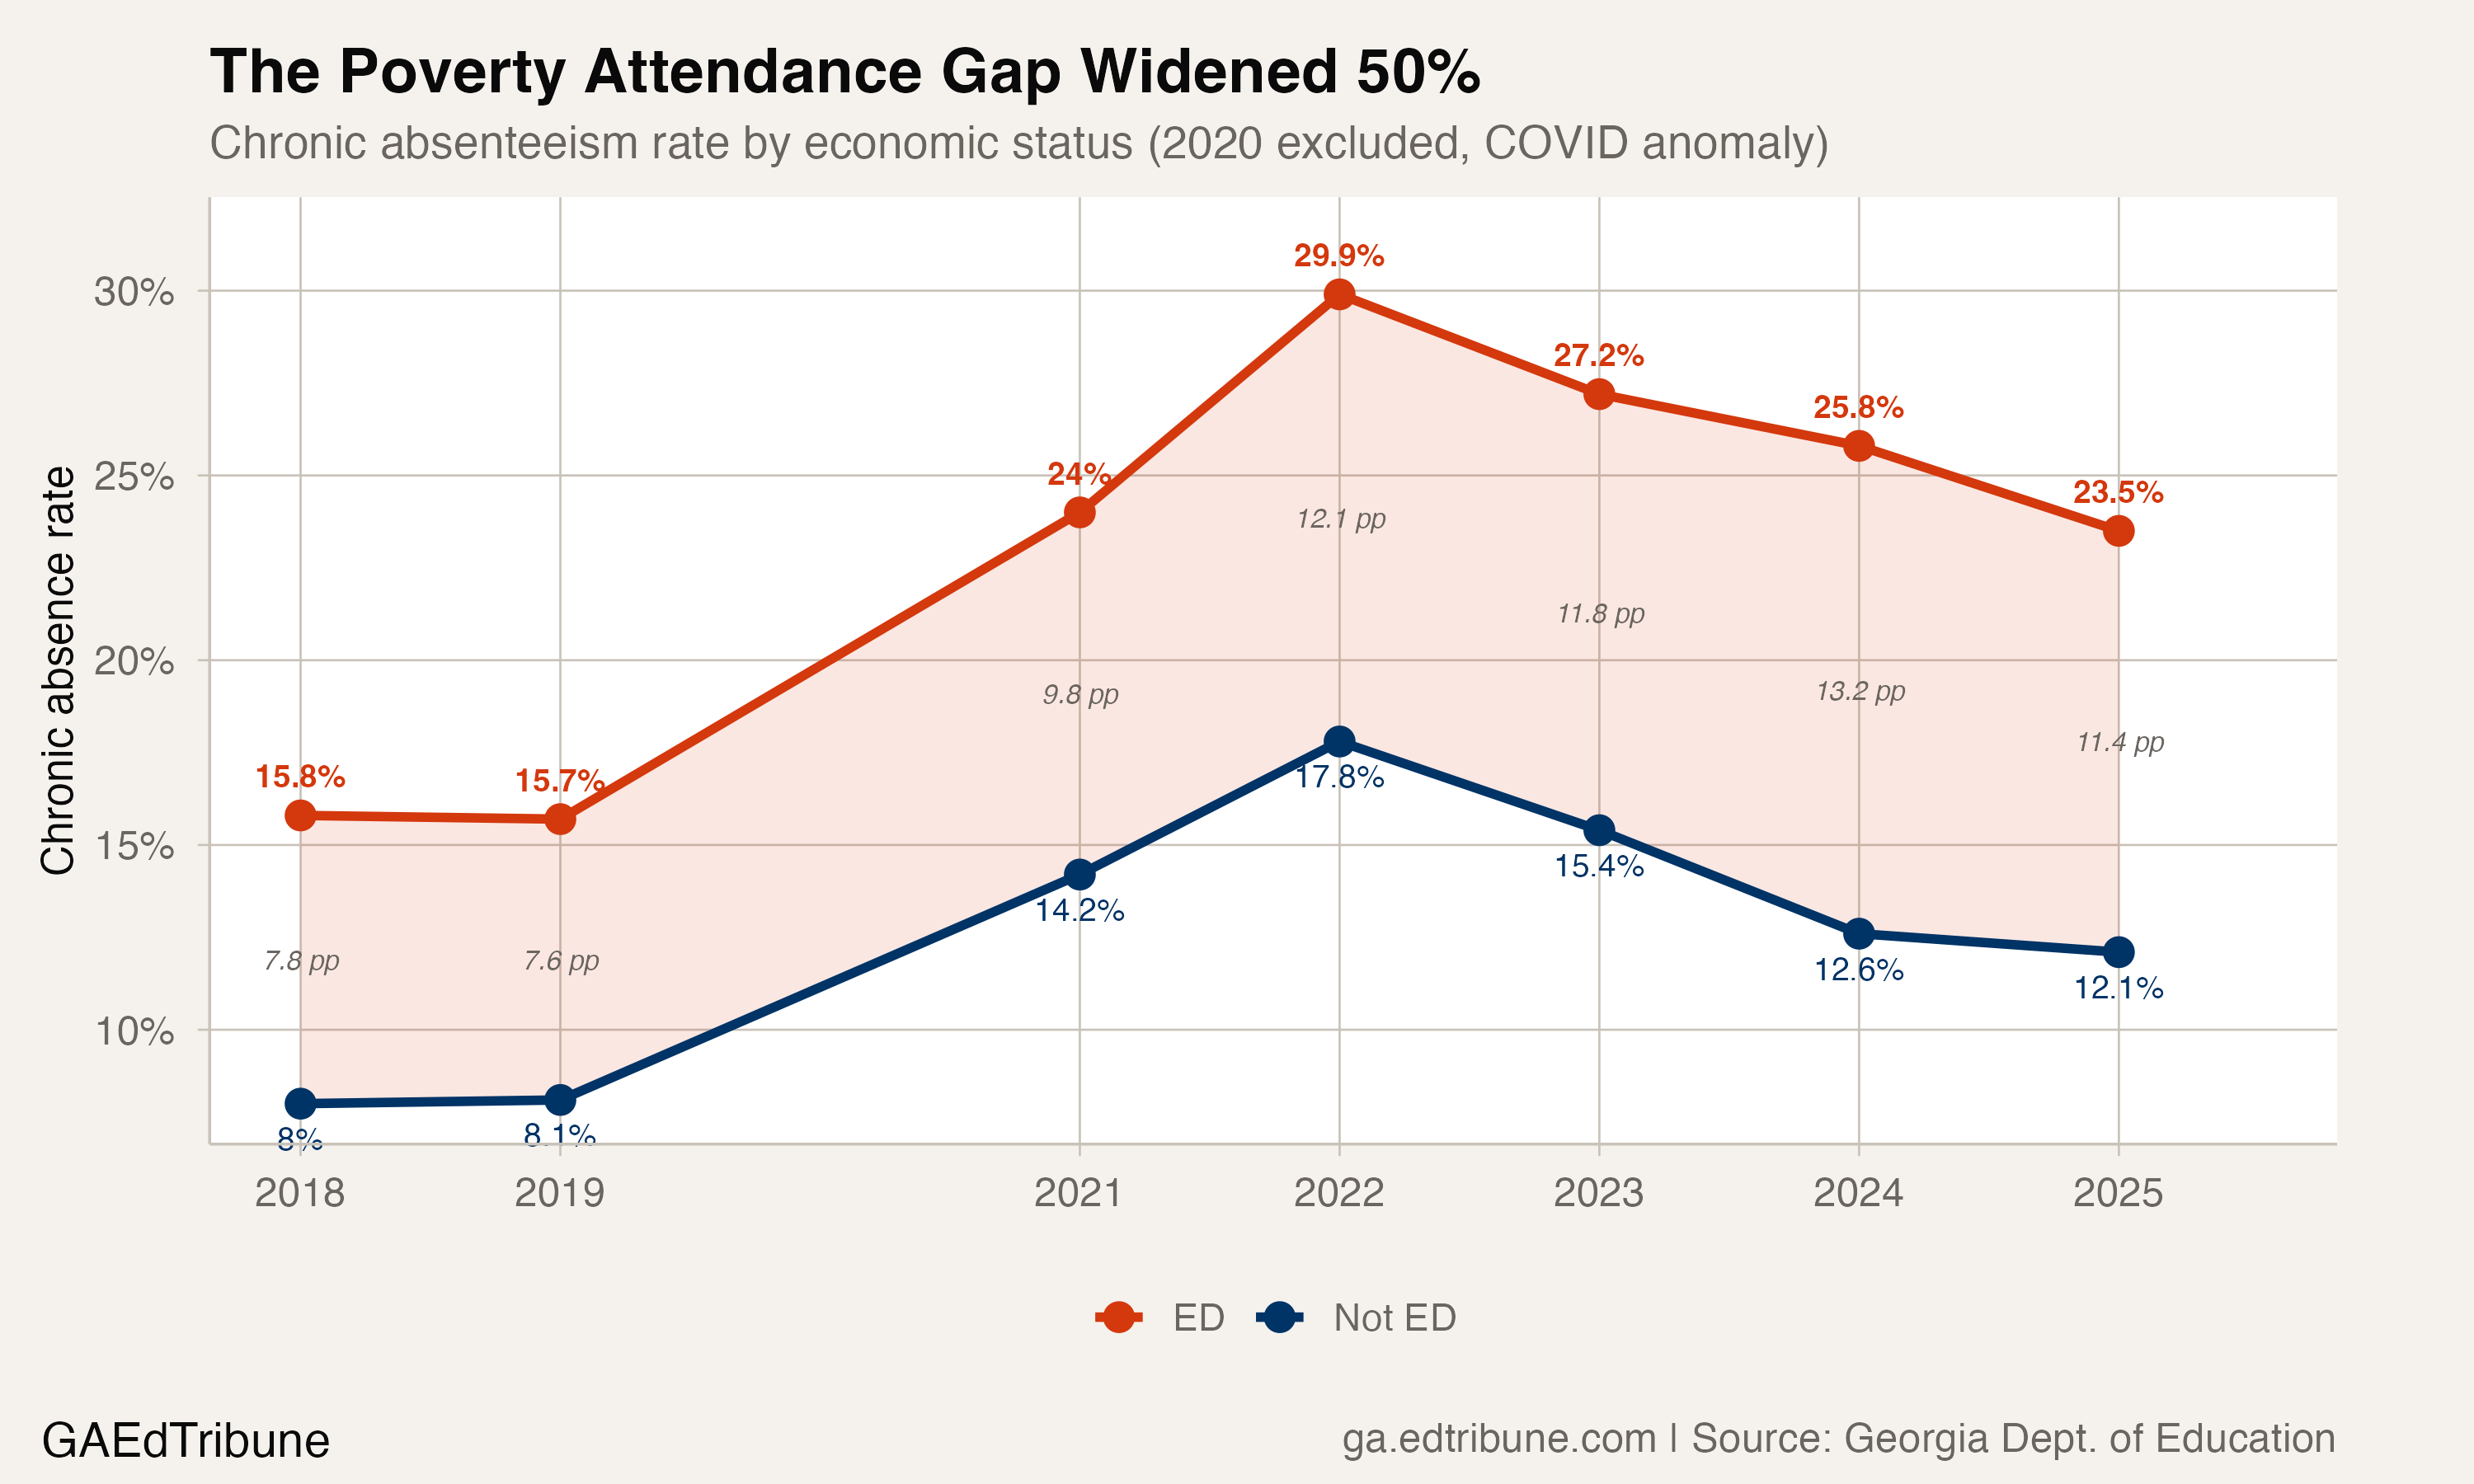
Statewide, 23.5% of students who are economically disadvantaged missed 10% or more of the school year in 2024-25, nearly double the 12.1% rate for their non-disadvantaged peers. The 11.4 percentage-point gap between those groups has widened 50% since before the pandemic, when the gap was 7.6 points. Georgia's overall chronic absenteeism problem, with 377,482 students missing significant instructional time, is not evenly distributed. It falls overwhelmingly on the 1.35 million students, 72.8% of total enrollment, classified as economically disadvantaged.
A gap that barely narrowed while overall rates improved
Georgia has made real progress on chronic absenteeism since the 2021-22 peak. The overall state rate dropped from 24.4% to 20.4%, recovering about 35% of the ground lost during the pandemic. Both groups improved: the rate among students who are economically disadvantaged fell from its 2022 peak of 29.9% to 23.5%, and the non-disadvantaged rate dropped from 17.8% to 12.1%.
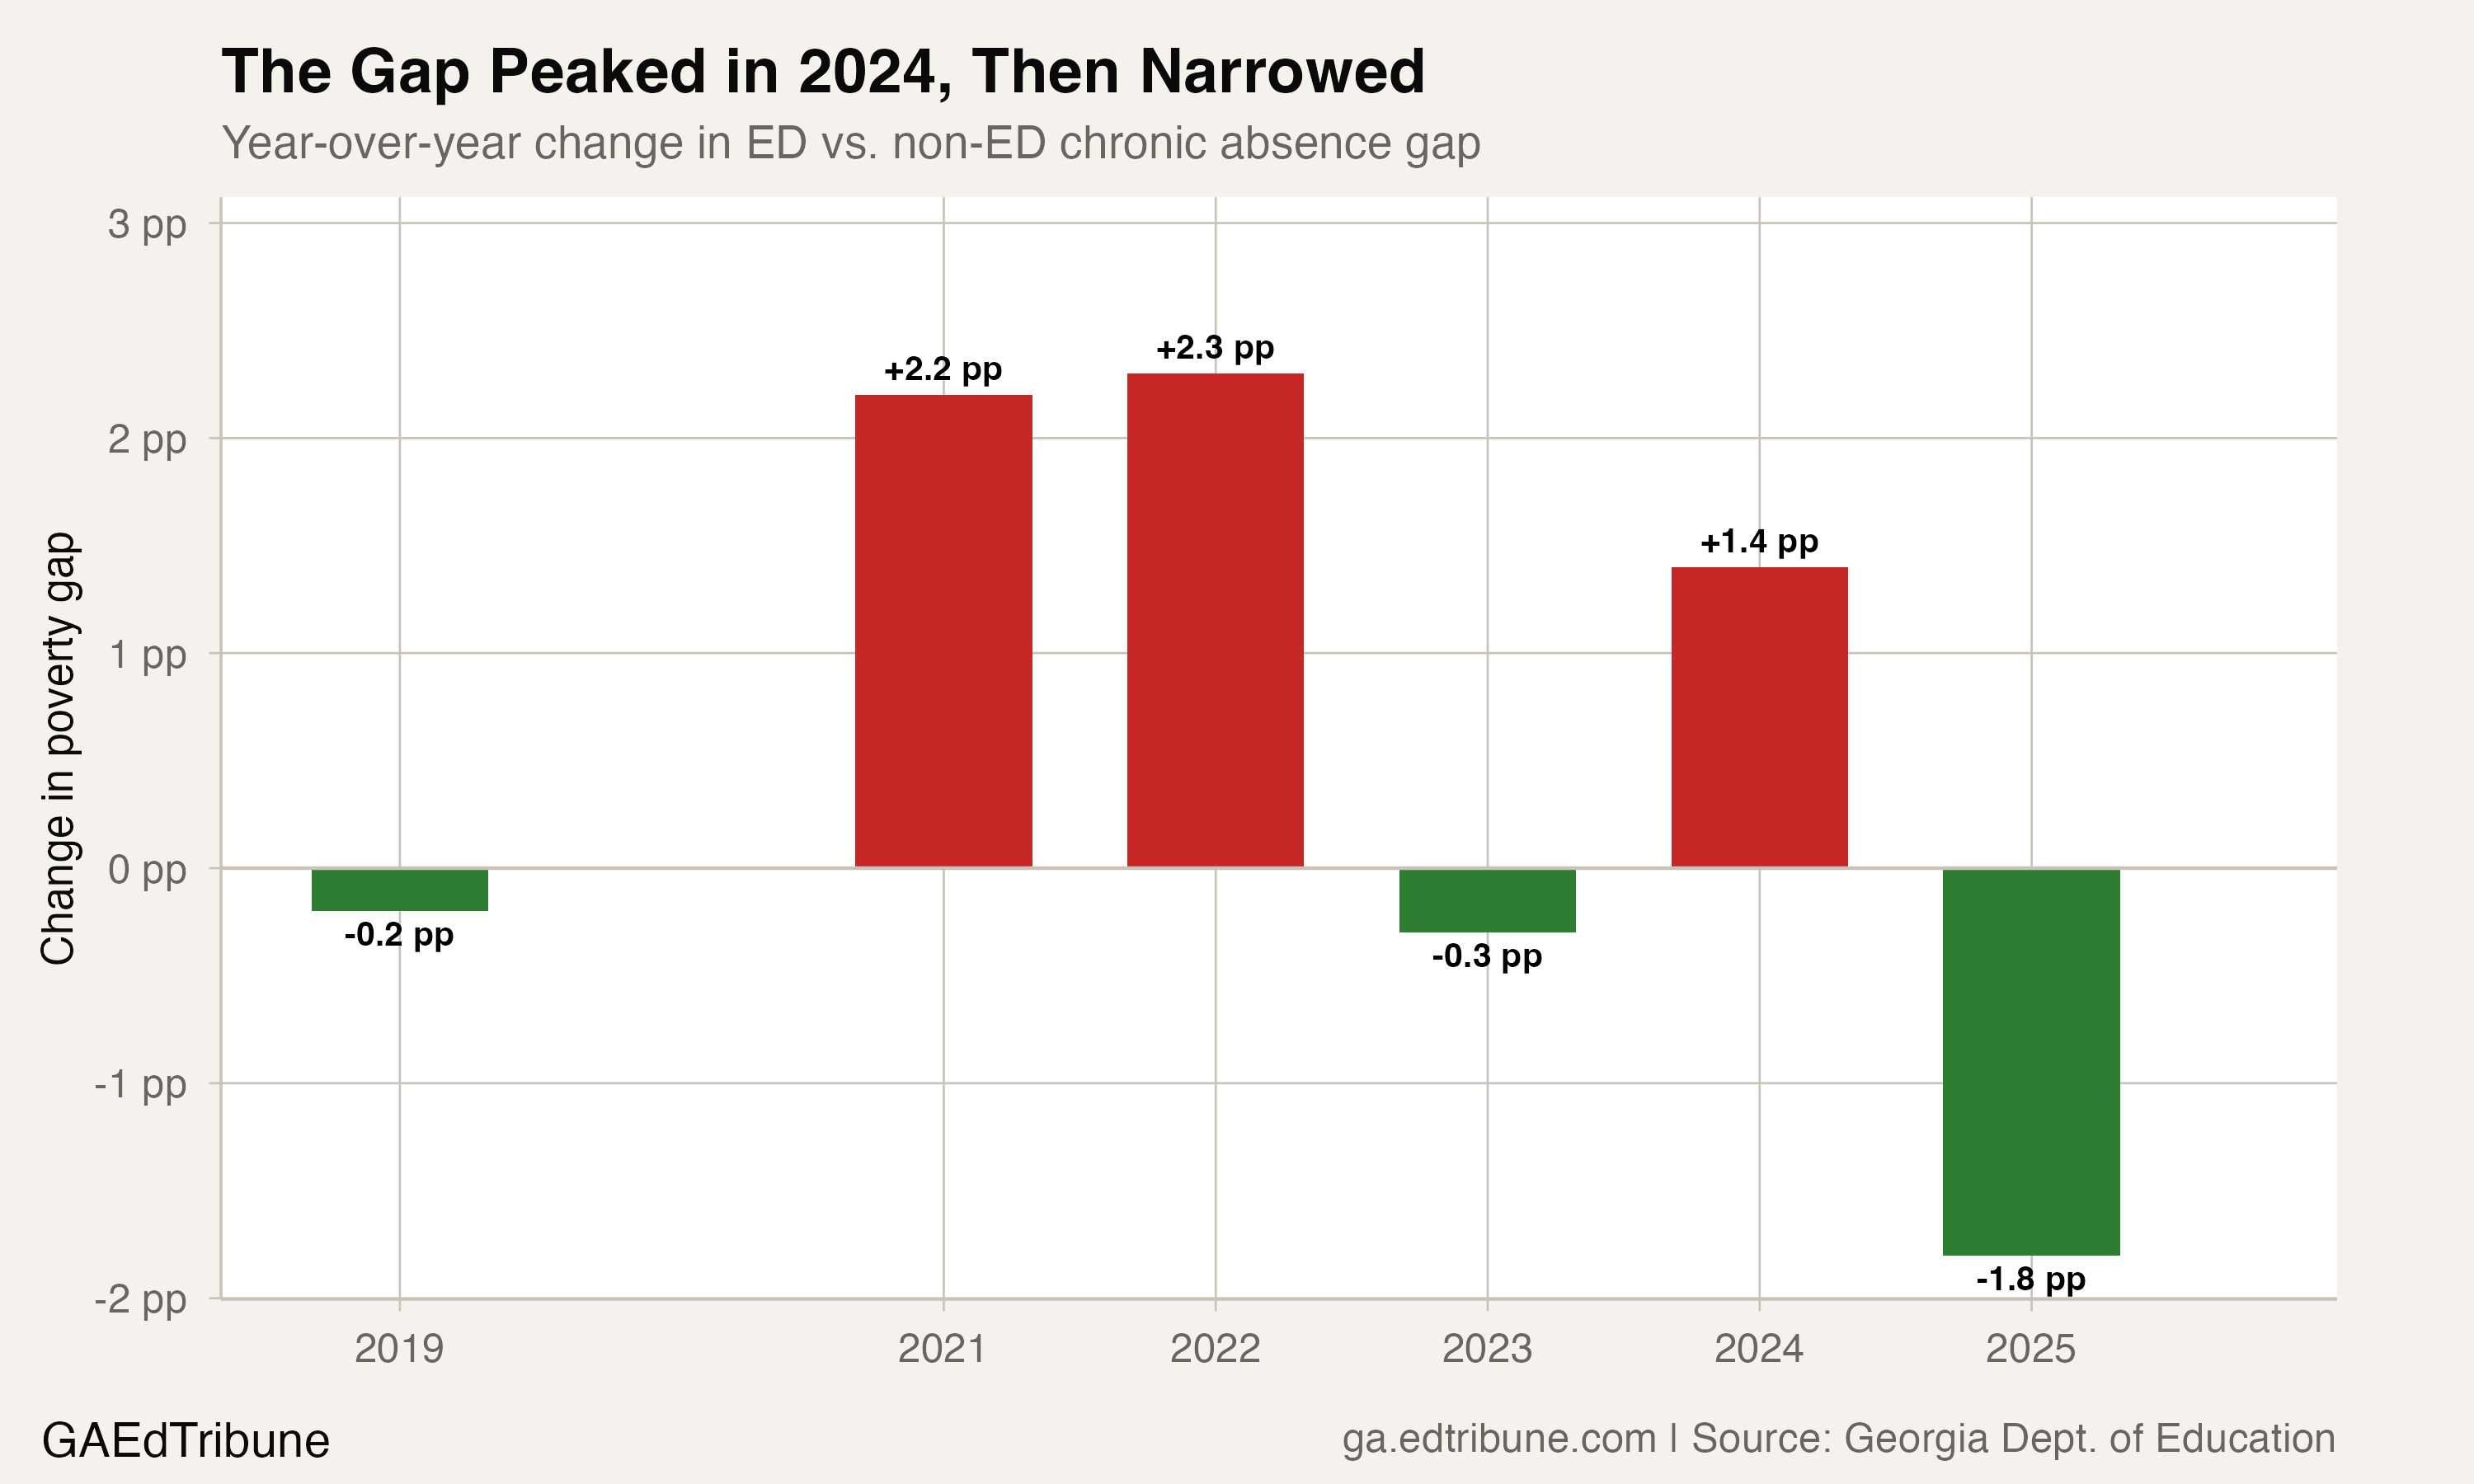
But the non-disadvantaged group recovered faster. Their rate is now just 4.0 points above the pre-COVID baseline of 8.1%, while students who are economically disadvantaged remain 7.8 points above their 2019 level of 15.7%. The gap peaked at 13.2 points in 2023-24 before narrowing 1.8 points in 2024-25, the largest single-year improvement since the pandemic. Even that improvement only brought the gap to 11.4 points, still 50% wider than 2019.
The rate ratio between the two groups has hovered around 1.9x for most of the past eight years, dipping to 1.7x during the 2021-22 disruption and peaking at 2.0x in 2023-24. In other words, students who are economically disadvantaged have been roughly twice as likely to be chronically absent as their peers both before and after the pandemic. What changed is the absolute magnitude: a 2x multiplier on a 15.7% rate produces a 7.6-point gap. The same multiplier on a 23.5% rate produces an 11.4-point gap.
The attendance distribution tells a sharper story
The chronic absence threshold, 10% of school days, captures only part of the picture. Georgia's attendance band data reveals a deeper structural divide.
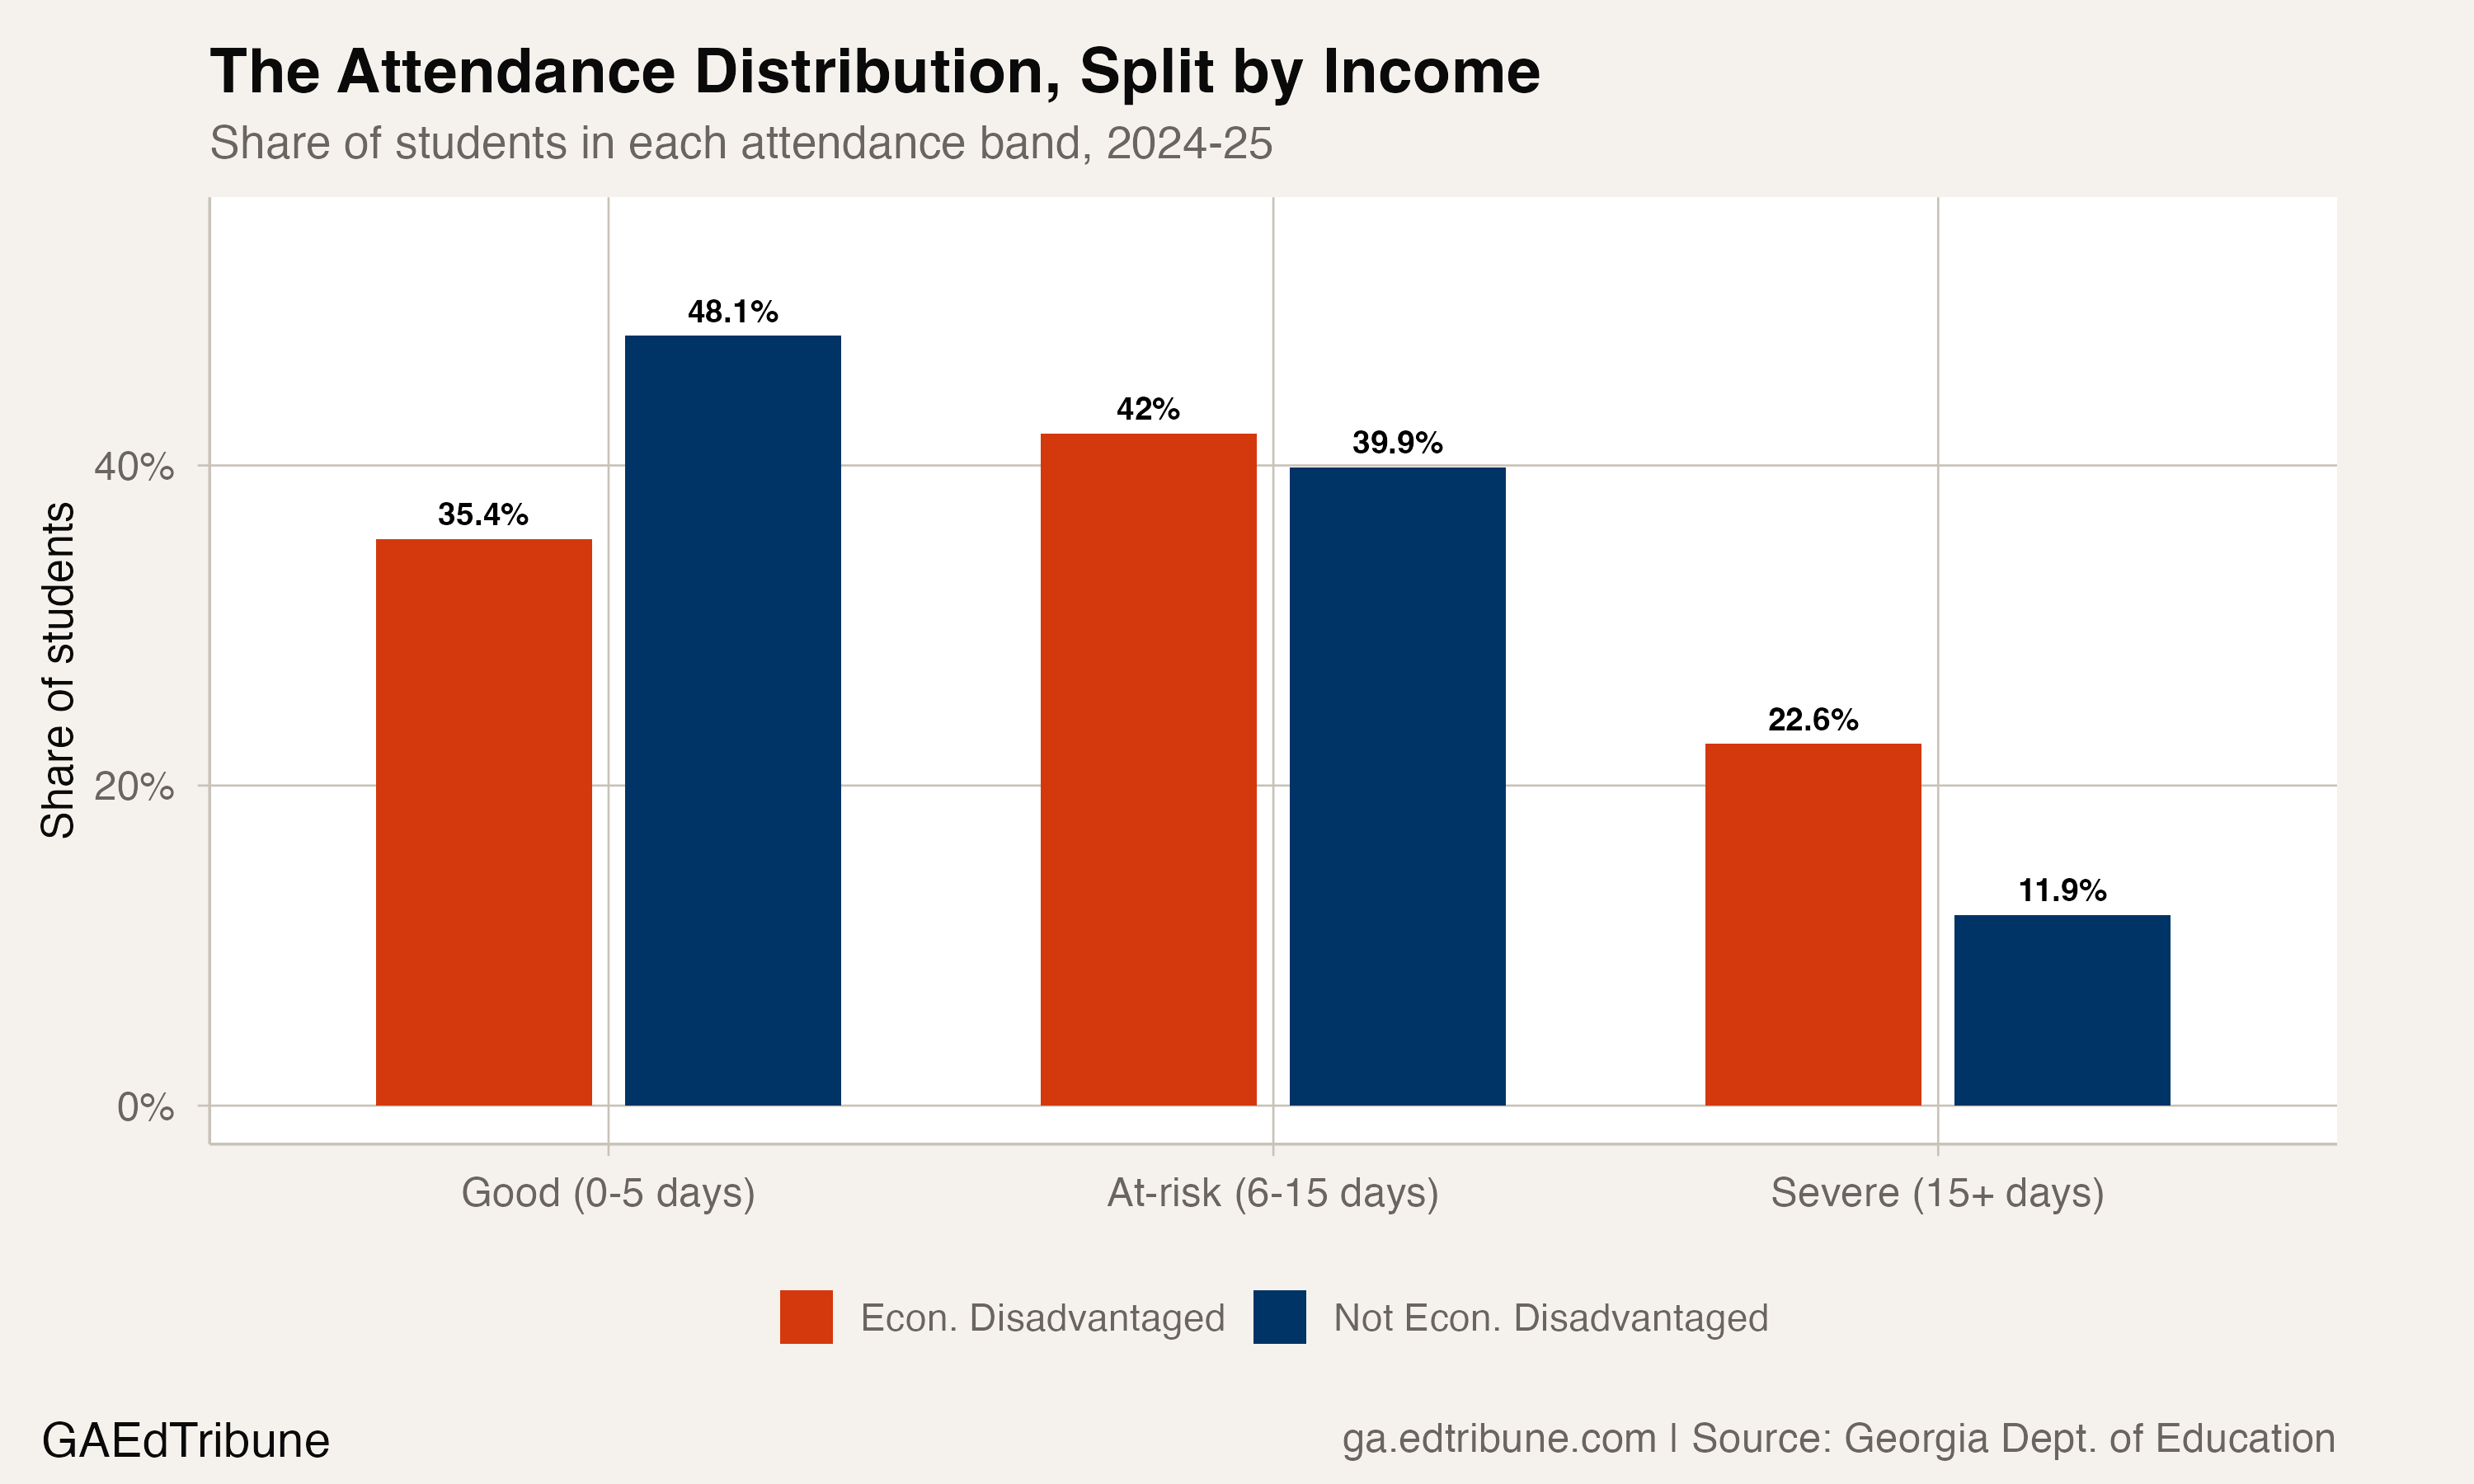
Among non-disadvantaged students, 48.1% had good attendance in 2024-25, missing five or fewer days. Among students who are economically disadvantaged, that figure was 35.4%. Before the pandemic, the split was 57.9% versus 48.5%, a 9.4-point gap that has widened to 12.7 points.
The severe end of the distribution is sharper still. Among students who are economically disadvantaged, 22.6% missed more than 15 days of school, nearly double the 11.9% rate for their non-disadvantaged peers. Before the pandemic, the severe absence rates were 14.5% and 7.8% respectively. Both groups saw severe absence grow, but the rate among students who are economically disadvantaged grew by 8.1 points compared to 4.1 points for their peers.
The barriers are not abstract
When the Georgia Senate Study Committee on Combating Chronic Absenteeism heard testimony in 2025, the stories were concrete. Carol Lewis of Communities in Schools described students who lacked access to clean clothing, hygiene products, or washing machines, barriers that make the act of walking into a school building harder before any academic question is asked.
These are not anomalies. Georgia has one school counselor for every 447 students, nearly double the recommended ratio of 1:250. The state has ranked among the worst nationally for access to mental health care, and roughly 75,000 Georgia children with major depression receive no treatment at all. In rural districts, bus driver shortages compound the problem. When a child's only reliable transportation to school disappears, absence follows.
The state's funding formula adds an indirect pressure. Georgia's Quality Basic Education formula funds districts based on FTE counts taken in October and March, not daily attendance. Chronic absenteeism does not directly reduce a district's state allocation in the way it would under an average-daily-attendance model. That insulates budgets from attendance volatility but also means districts face no direct fiscal penalty for failing to get students in seats. The Georgia Budget and Policy Institute has advocated for an "opportunity weight" that would provide an additional 25% in QBE funding for each student living in poverty, recognizing that these students' instructional programs carry higher per-pupil costs.
Not every district looks the same
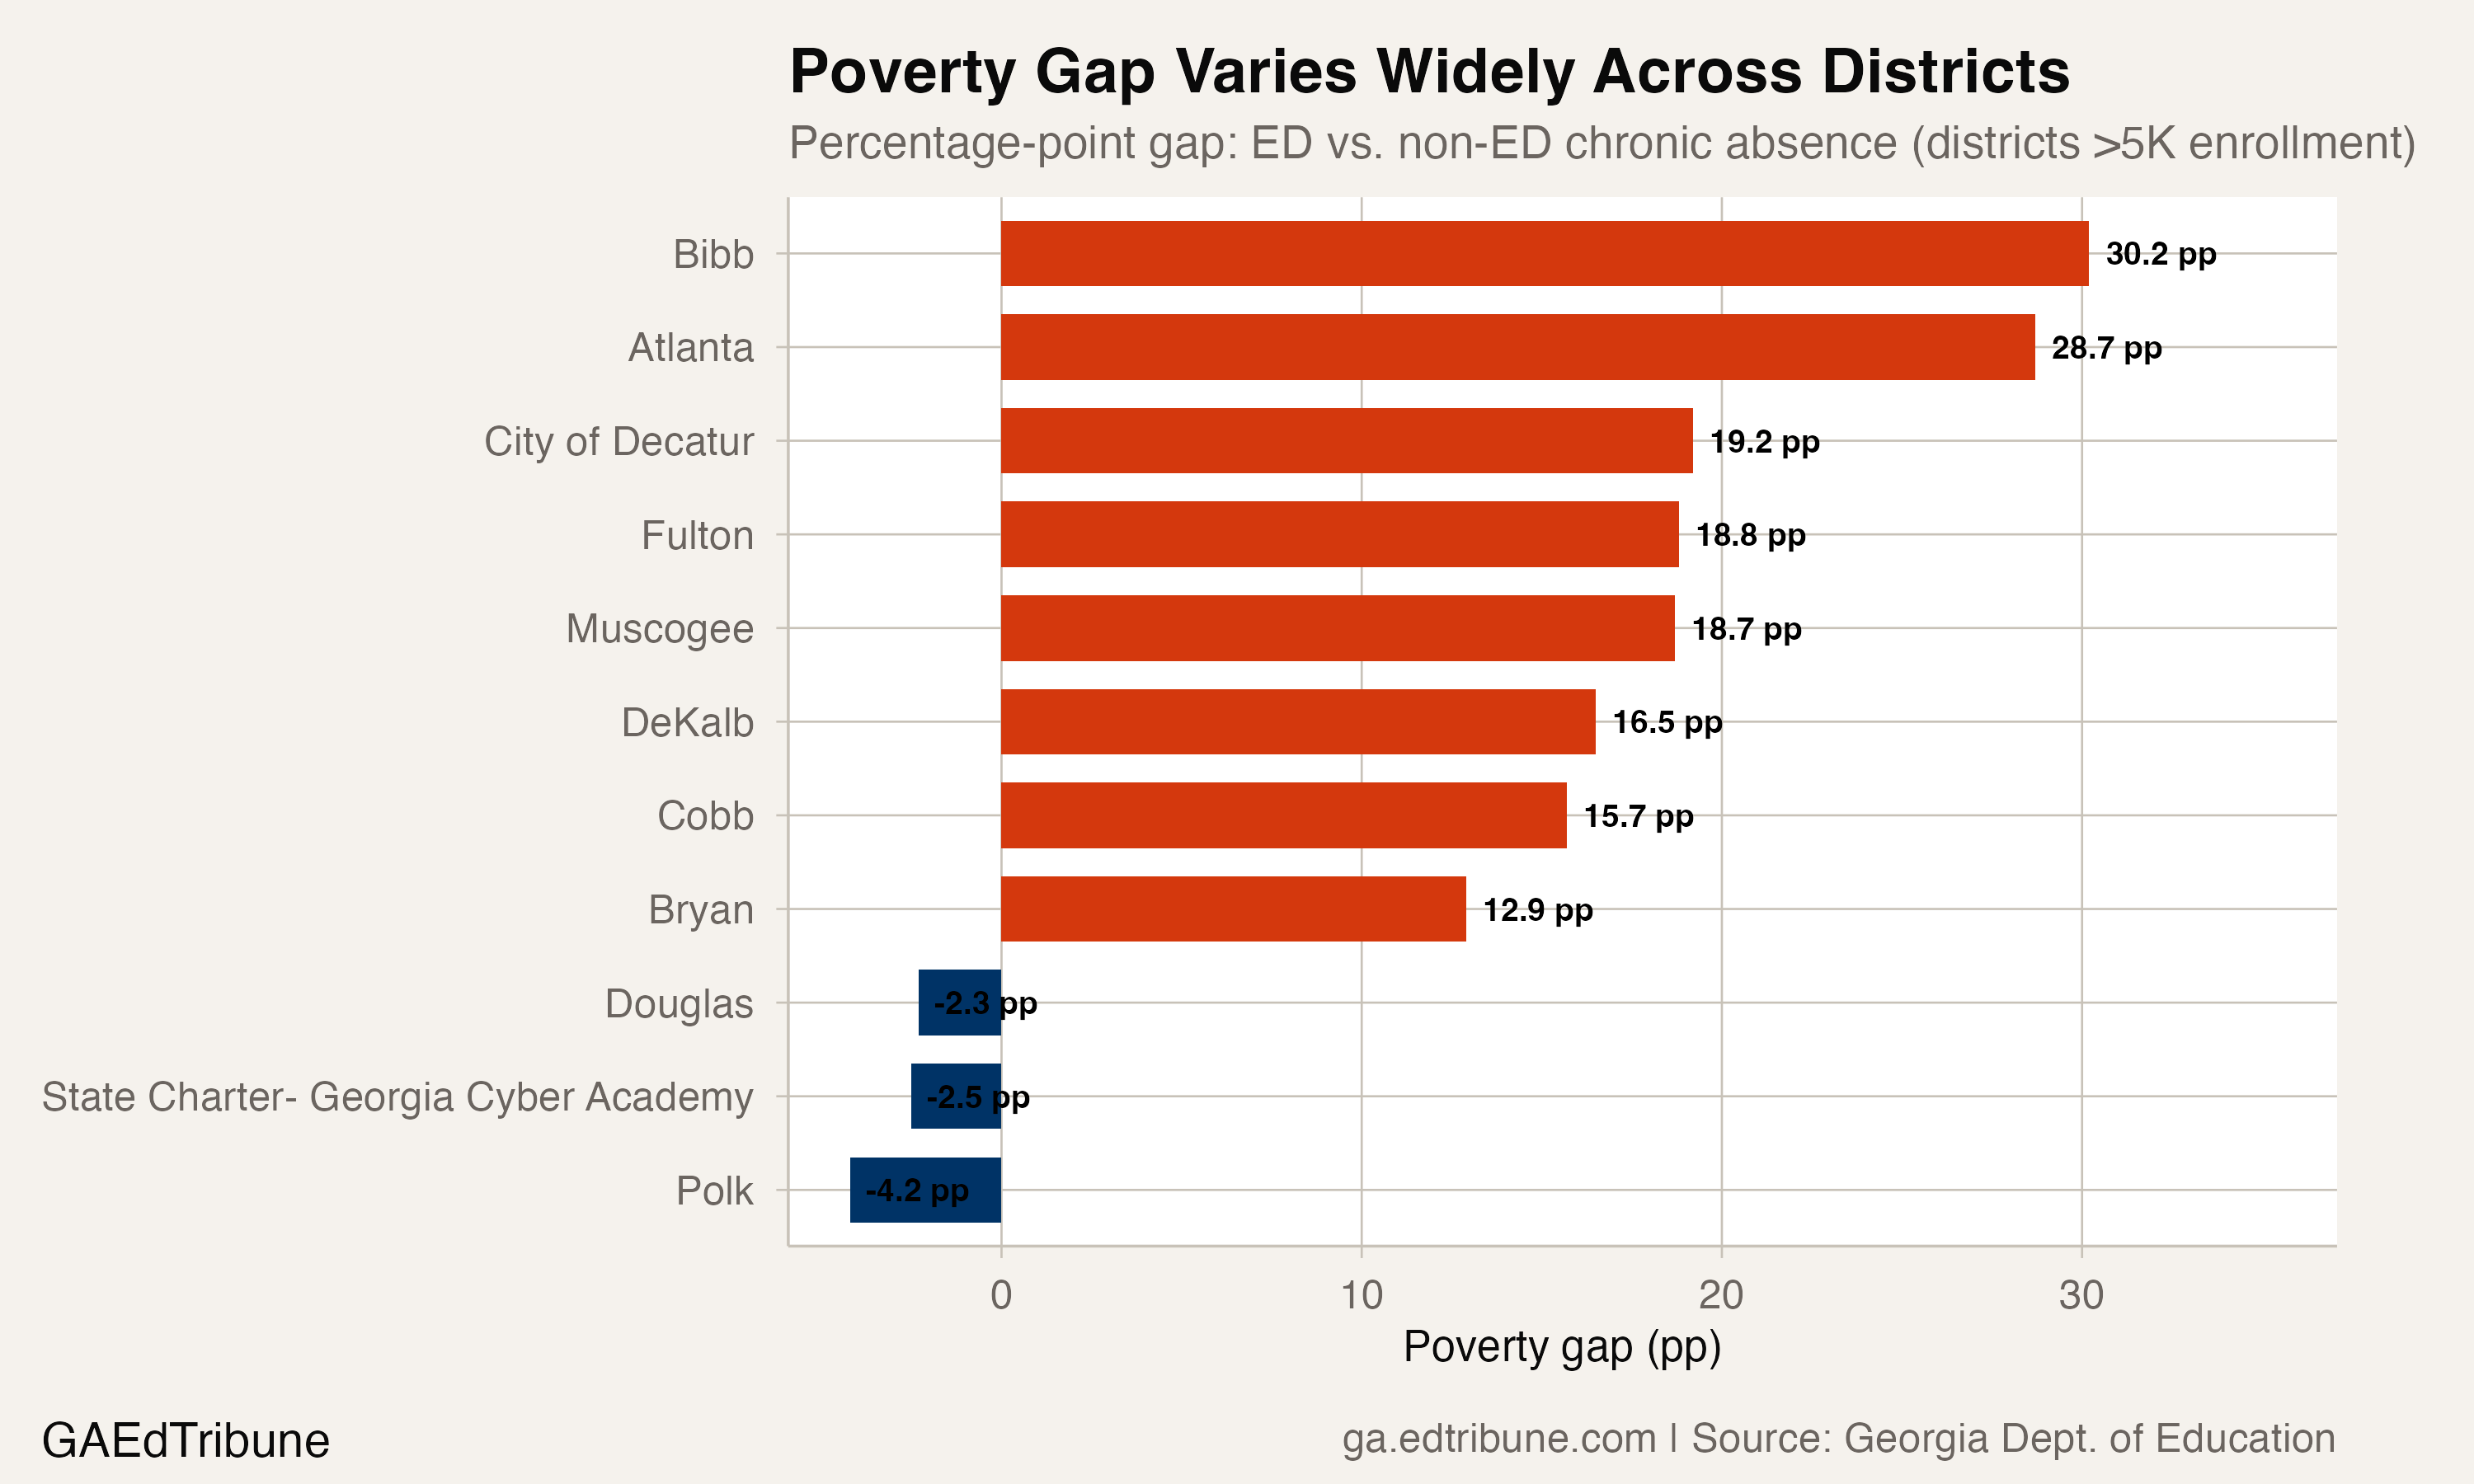
The statewide 11.4-point gap obscures enormous variation at the district level. Among large districts with more than 20,000 students, the poverty gap ranges from 30.2 points in Bibb County to a negative 2.3 points in Douglas County↗ET, where non-disadvantaged students actually have a slightly higher chronic absence rate than their peers who are economically disadvantaged.
Atlanta Public Schools↗ET has the second-largest gap among major districts at 28.7 points: a 37.9% chronic absence rate for students who are economically disadvantaged against 9.2% for their non-disadvantaged peers. Fulton County↗ET, which surrounds Atlanta, has a gap of 18.8 points. Cobb County↗ET, the state's second-largest district by enrollment, sits at 15.7 points.
The affluent northern suburbs show a different pattern. Forsyth County↗ET, with 56,495 students, has a 9.9-point gap, below the state average. Gwinnett County↗ET, the largest district at 199,231 students, has a gap of just 4.4 points, one of the smallest among major districts. These are districts where even students who are economically disadvantaged have access to the transportation, health care, and wraparound services that make daily attendance possible.
What 72.8% actually means
Georgia classifies 72.8% of its students as economically disadvantaged. That figure is worth pausing on. It means students who are economically disadvantaged are not a minority subpopulation; they are the state's student body. The 503,892 non-disadvantaged students are the smaller group.
This has a mathematical consequence for the gap. Students who are economically disadvantaged make up 72.8% of enrollment but 83.8% of chronically absent students. Their share of chronic absence has grown from 78.7% in 2018 to 83.8% in 2025, even as their enrollment share grew from 65.1% to 72.8%.
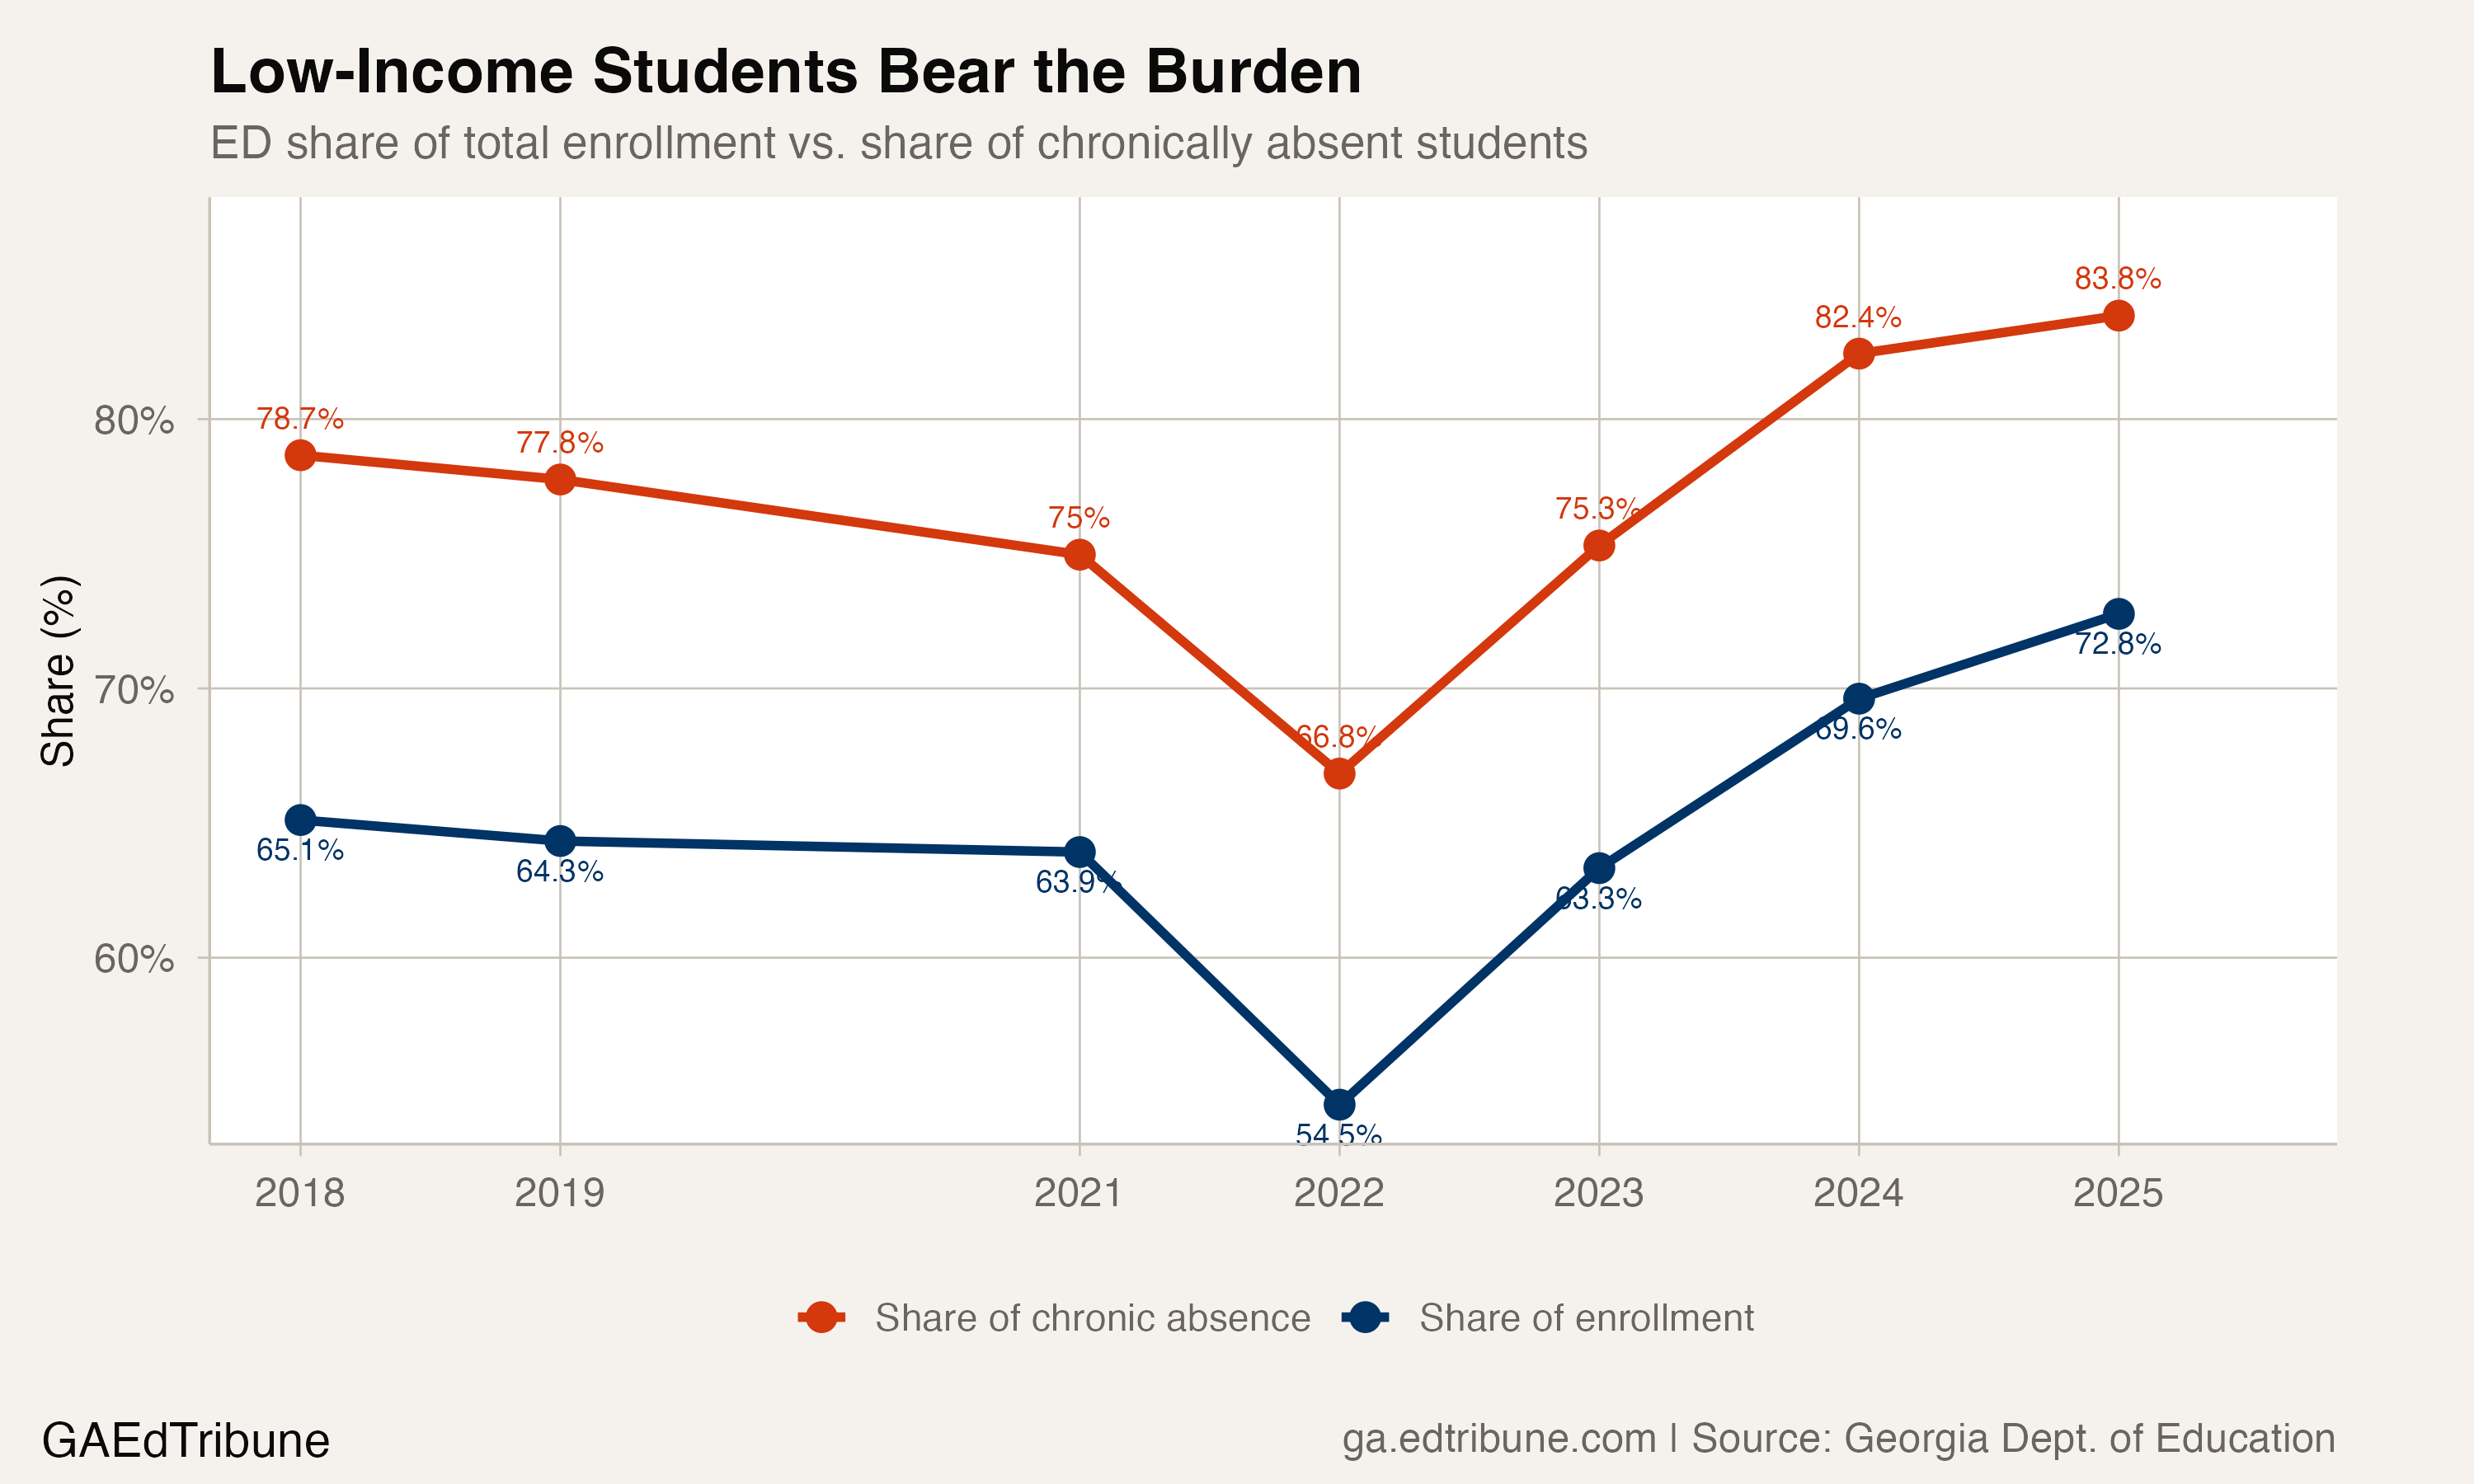
The rising classification rate itself deserves scrutiny. Georgia's economically disadvantaged share jumped from 54.5% in 2022 to 63.3% in 2023 to 69.6% in 2024 to 72.8% in 2025. Part of this reflects genuine economic hardship. Part almost certainly reflects expanded Community Eligibility Provision (CEP) adoption, which allows entire schools to classify all students as economically disadvantaged for meal program purposes when a threshold of directly certified students is met. A district reporting 100% economically disadvantaged, as 146 Georgia districts do, is not reporting that every family lives in poverty. It is reporting that the district participates in CEP.
This means the "non-disadvantaged" comparison group is shrinking and likely becoming less representative over time. As more moderate-income students get reclassified through CEP expansion, the remaining non-ED students may skew increasingly affluent, which could artificially widen the measured gap. The underlying attendance disparities are real, but the precise magnitude of the gap should be read with this CEP effect in mind.
The policy response is just beginning
Governor Kemp signed SB 123 on April 28, 2025, prohibiting schools from expelling students solely due to absences and requiring attendance review teams in districts where more than 10% of students are chronically absent and schools where more than 15% are. Given that the statewide rate is 20.4%, nearly every district in the state triggers that threshold. State Superintendent Richard Woods has committed to the national 50% Challenge, pledging to halve chronic absence within five years.
The Senate Study Committee that concluded in November 2025 recommended a three-tier attendance model: universal prevention, targeted supports, and individualized interventions for the most disconnected students. It also called for a standing cross-agency task force linking education, juvenile justice, health, housing, and transportation, an acknowledgment that attendance barriers extend far beyond what happens inside a school building.
The 316,430 students who are economically disadvantaged and were chronically absent last year did not miss school because they lacked attendance policies. They missed school because something in their daily lives, a bus that did not come, an untreated illness, a parent working the overnight shift with no backup for the morning routine, made showing up harder than staying home. Georgia's policy apparatus is building the infrastructure to identify these students. What it has not yet built is the capacity to change what keeps them away.
Detailed code that reproduces the analysis and figures in this article is available exclusively to EdTribune subscribers.
Discussion
Sign in to join the discussion.
Loading comments...