In Clayton County, south of Atlanta, more than one in three special education students missed at least 18 days of school last year. In Decatur County, near the Florida border, the number was closer to two in five. These are not outliers born of the pandemic. Before COVID-19 disrupted Georgia's schools, the special education chronic absence rate was already 17.9%, nearly six percentage points higher than students without disabilities. That gap has barely budged in eight years.
Georgia's overall chronic absenteeism story since the pandemic has been about gaps that exploded: the Black-white gap nearly tripled, the poverty gap widened by half. The special education gap did neither. It held steady at roughly 5.5 percentage points above non-special-education students in 2019 and sits at 5.5 points today. Both groups surged after COVID and both have been recovering at nearly identical rates. The gap itself was baked in long before anyone had heard of remote learning.
That stability is the story. COVID reshaped Georgia's attendance landscape, but it did not reshape the structural barriers that keep students with disabilities out of school at higher rates. Those barriers, from medical appointments to transportation to a mental health system ranked 49th in the nation, were already there. They survived the pandemic intact.
68,000 students, 5.5 points
In 2024-25, 25.1% of Georgia's 272,316 special education students were chronically absent, the highest rate of any subgroup tracked by the state. That translates to roughly 68,000 students with Individualized Education Programs missing 18 or more days of instruction, instruction specifically designed around their needs.
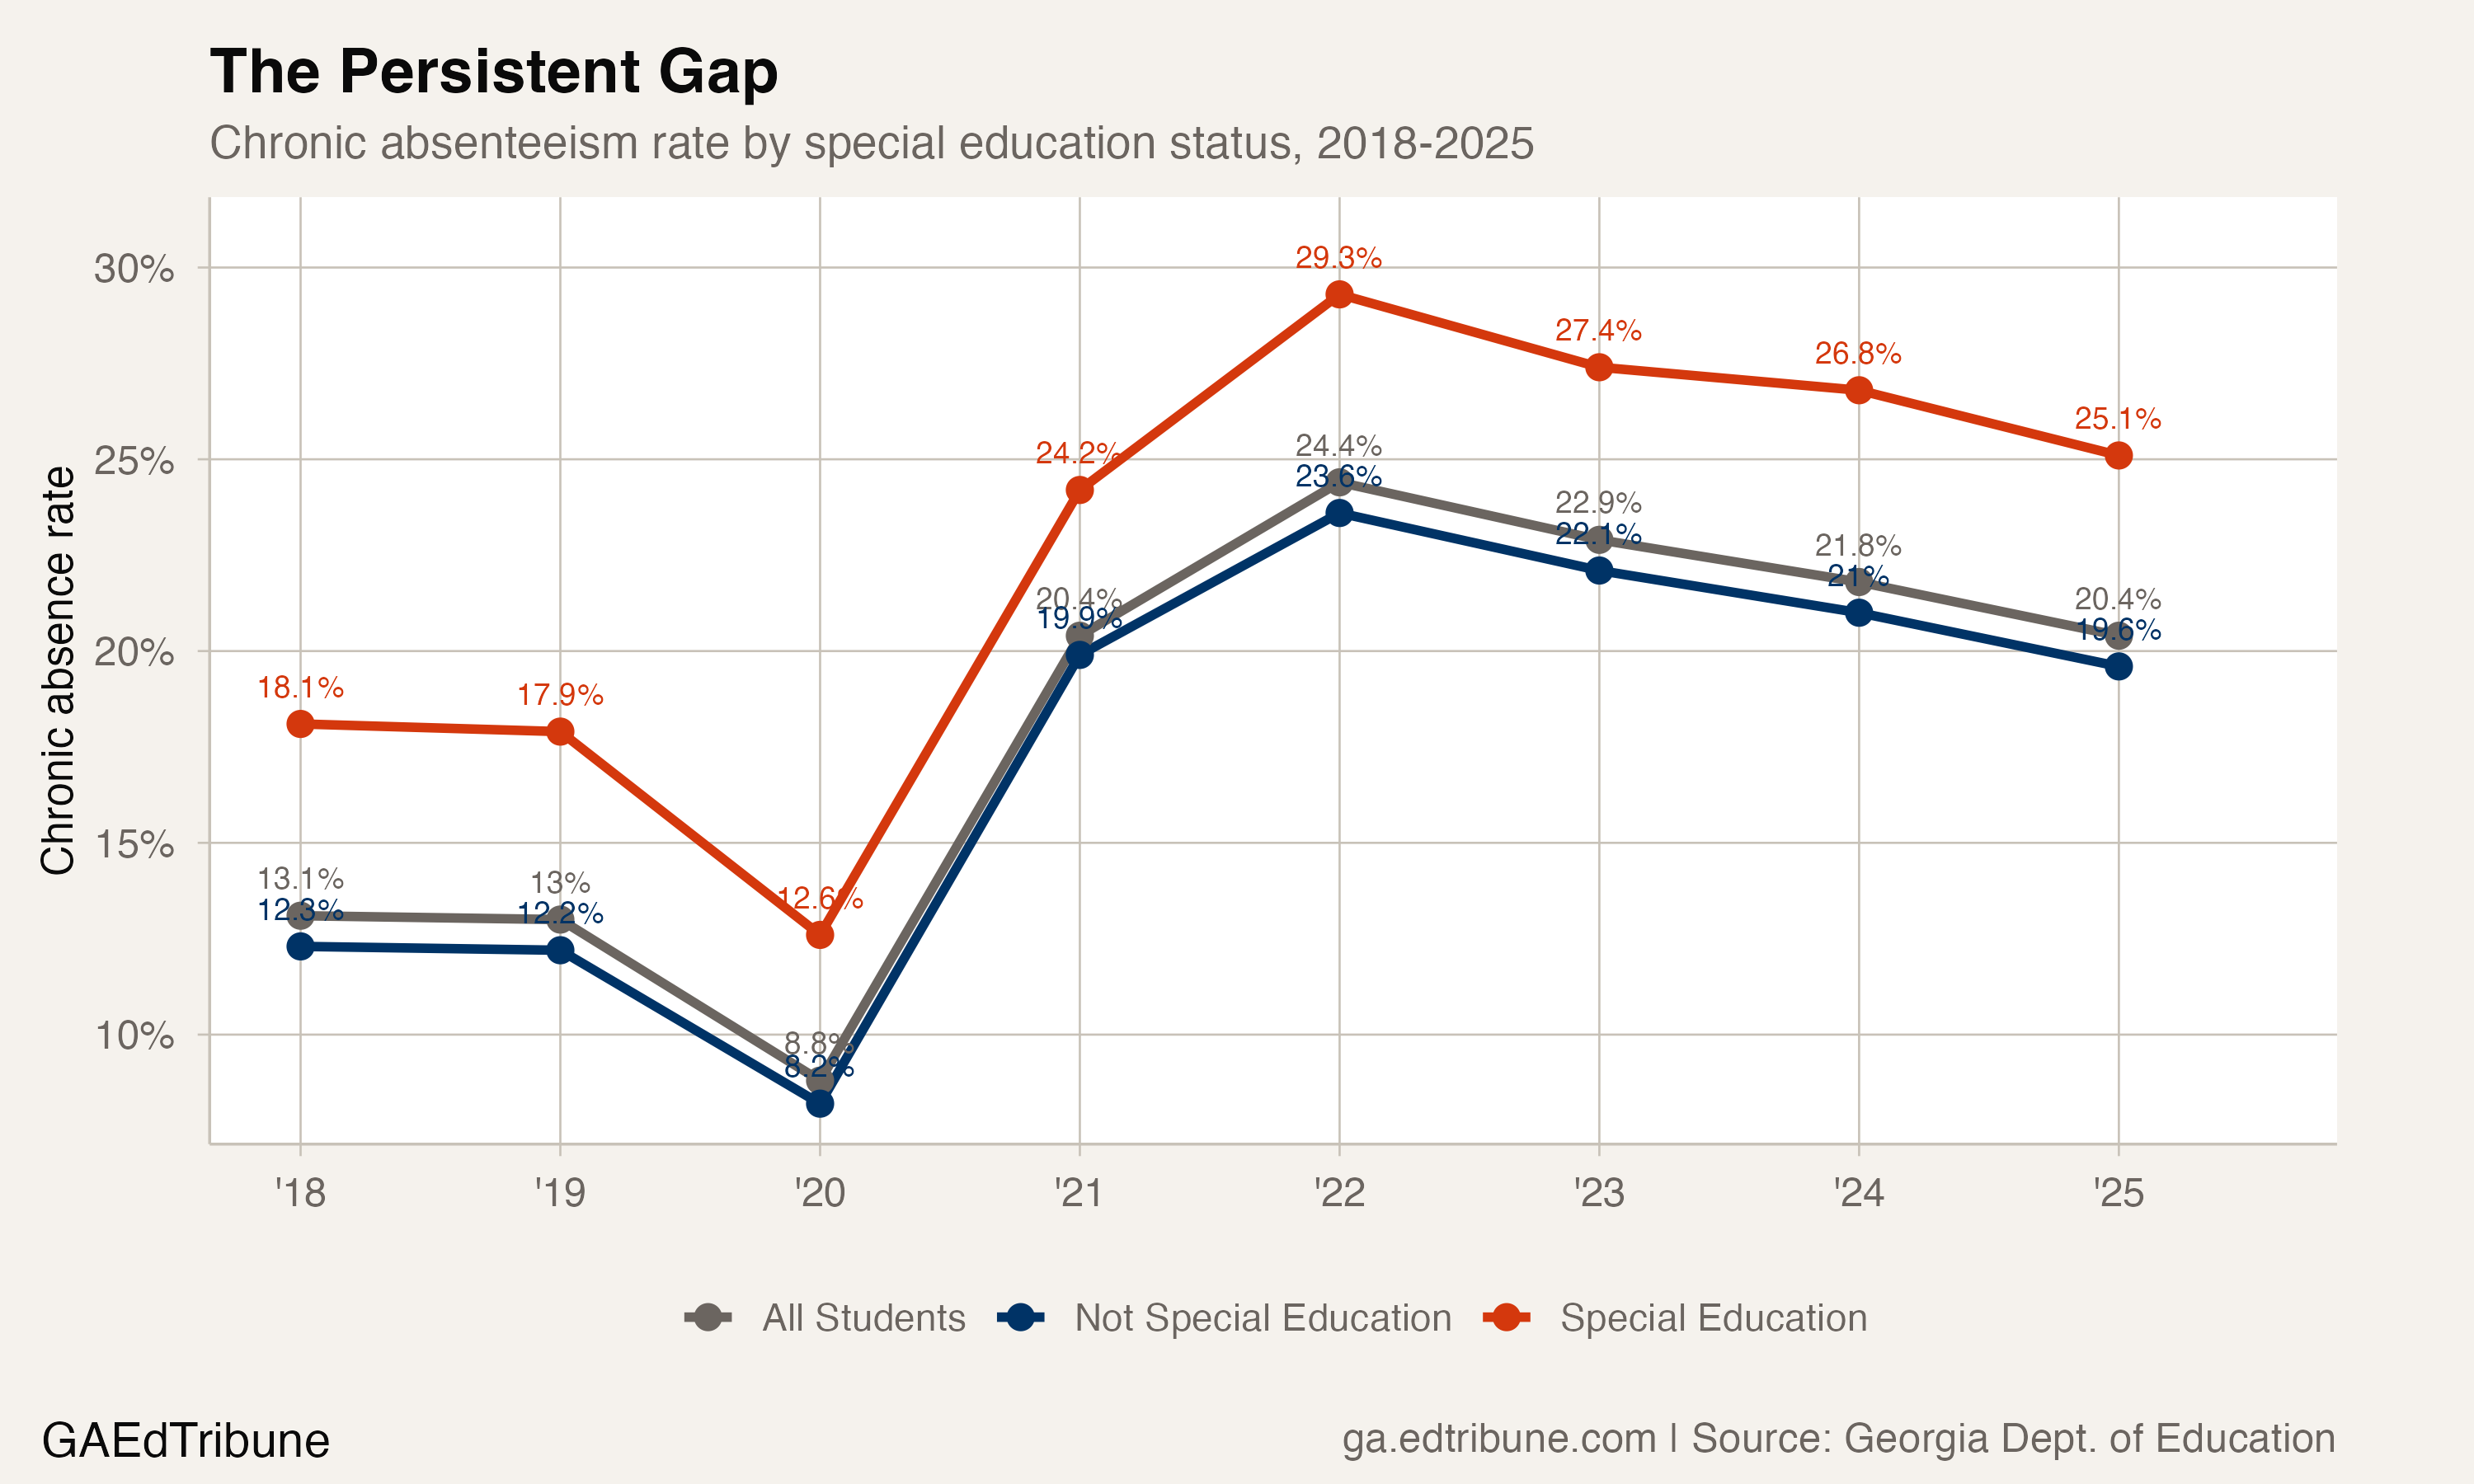
The rate peaked at 29.3% during the 2021-22 post-COVID surge and has declined for three consecutive years. But the pre-pandemic baseline was 17.9%. At 25.1%, special education students have recovered just 37% of the ground lost since COVID, slightly better than the statewide recovery rate of 35%.
Non-special-education students followed an almost identical trajectory: 12.2% before COVID, a 23.6% peak in 2021-22, and 19.6% in 2024-25. The gap between the two groups has ranged from 4.3 to 5.8 percentage points since 2018, with no discernible trend in either direction. It was 5.7 points in 2018-19 and 5.5 points now.
The gap that held still
What makes the special education gap unusual is its immunity to the forces that reshaped every other equity gap in Georgia's attendance data.
The Black-white chronic absence gap was 2.9 percentage points before COVID. By 2024-25 it had widened to 7.5 points, a 2.6-fold increase. The poverty gap expanded from 7.6 to 11.4 points. Both of those gaps worsened because the pandemic hit already-disadvantaged communities harder and the recovery has been uneven.
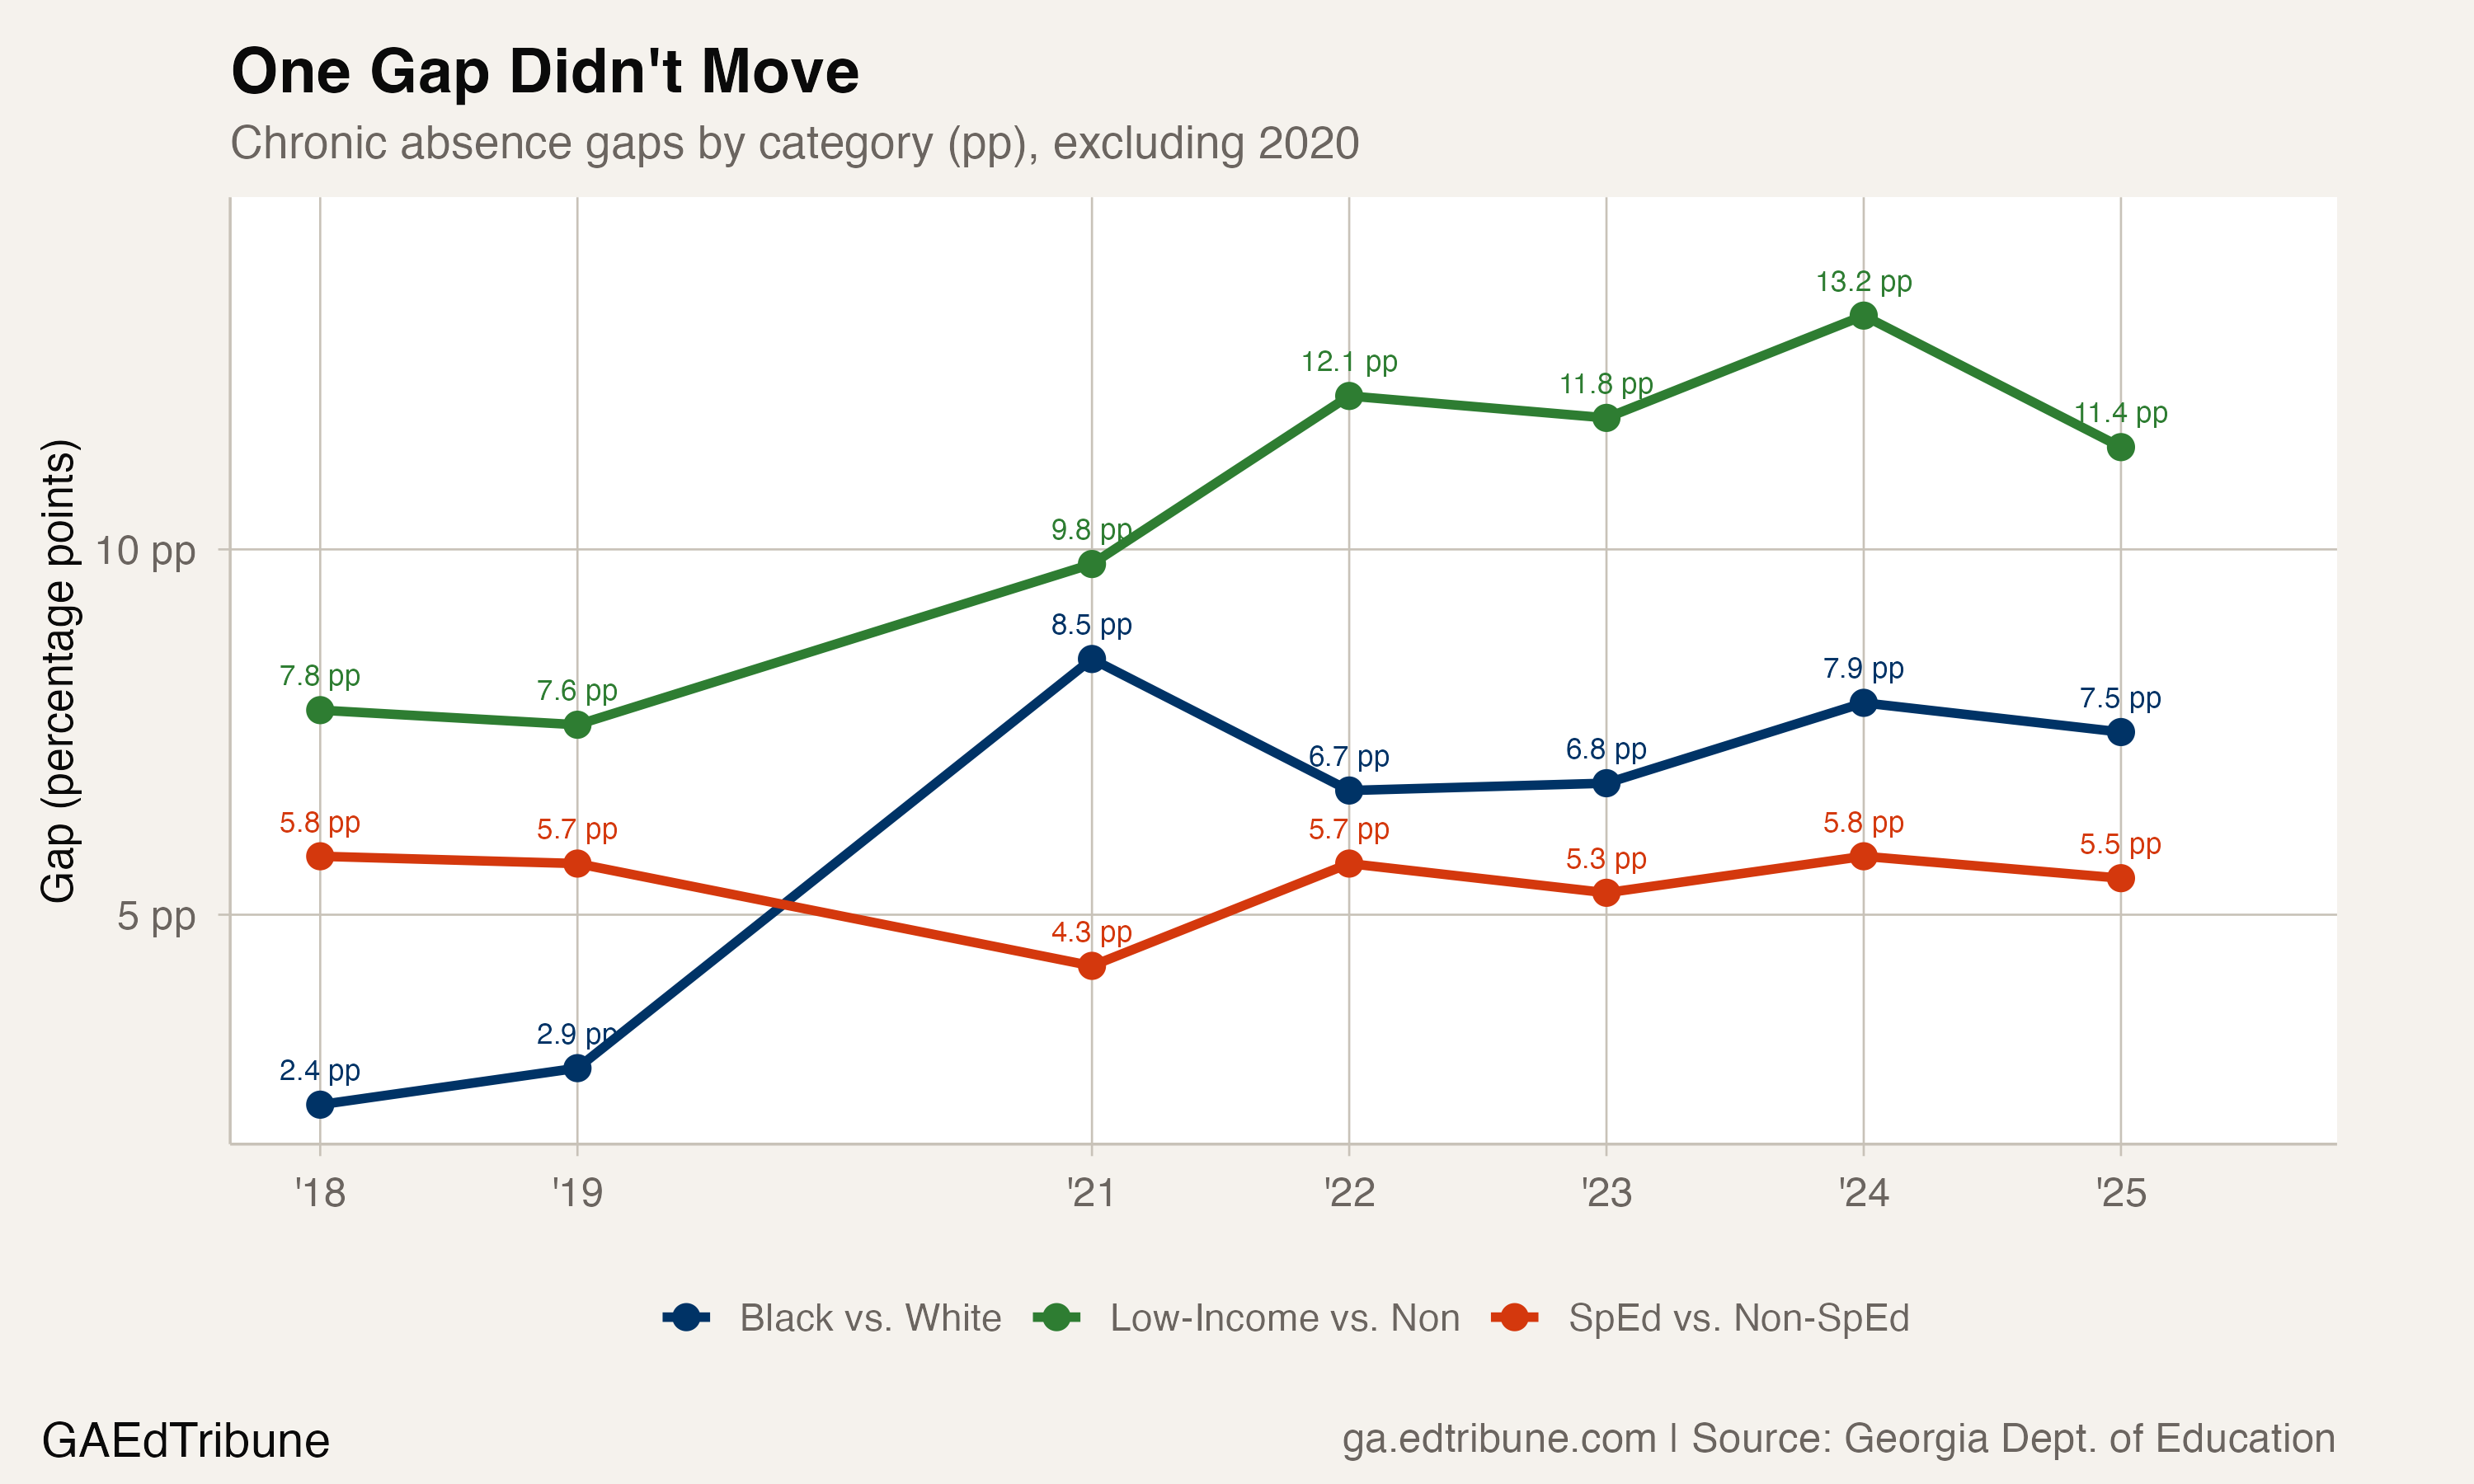
The special education gap moved from 5.7 to 5.5 points over the same period. It did not widen during the COVID surge, and it did not narrow during the recovery. Both special education and non-special-education students rose and fell together, as if the gap were a fixed feature of the system rather than a product of any particular disruption.
That pattern points toward structural causes rather than situational ones. Racial and economic gaps widened because the pandemic introduced new barriers, disproportionately concentrated in Black and low-income communities, that did not fully recede. The special education gap held steady because its underlying drivers, medical needs, transportation logistics, and behavioral health challenges, were neither created nor resolved by COVID.
One caveat: Georgia's special education enrollment grew 10.5% over this period, from 246,377 to 272,316 students. If the newly identified students have different attendance patterns than those already receiving services, the stable gap could partly reflect changing composition rather than unchanged barriers. The data cannot distinguish the two.
Where it gets severe
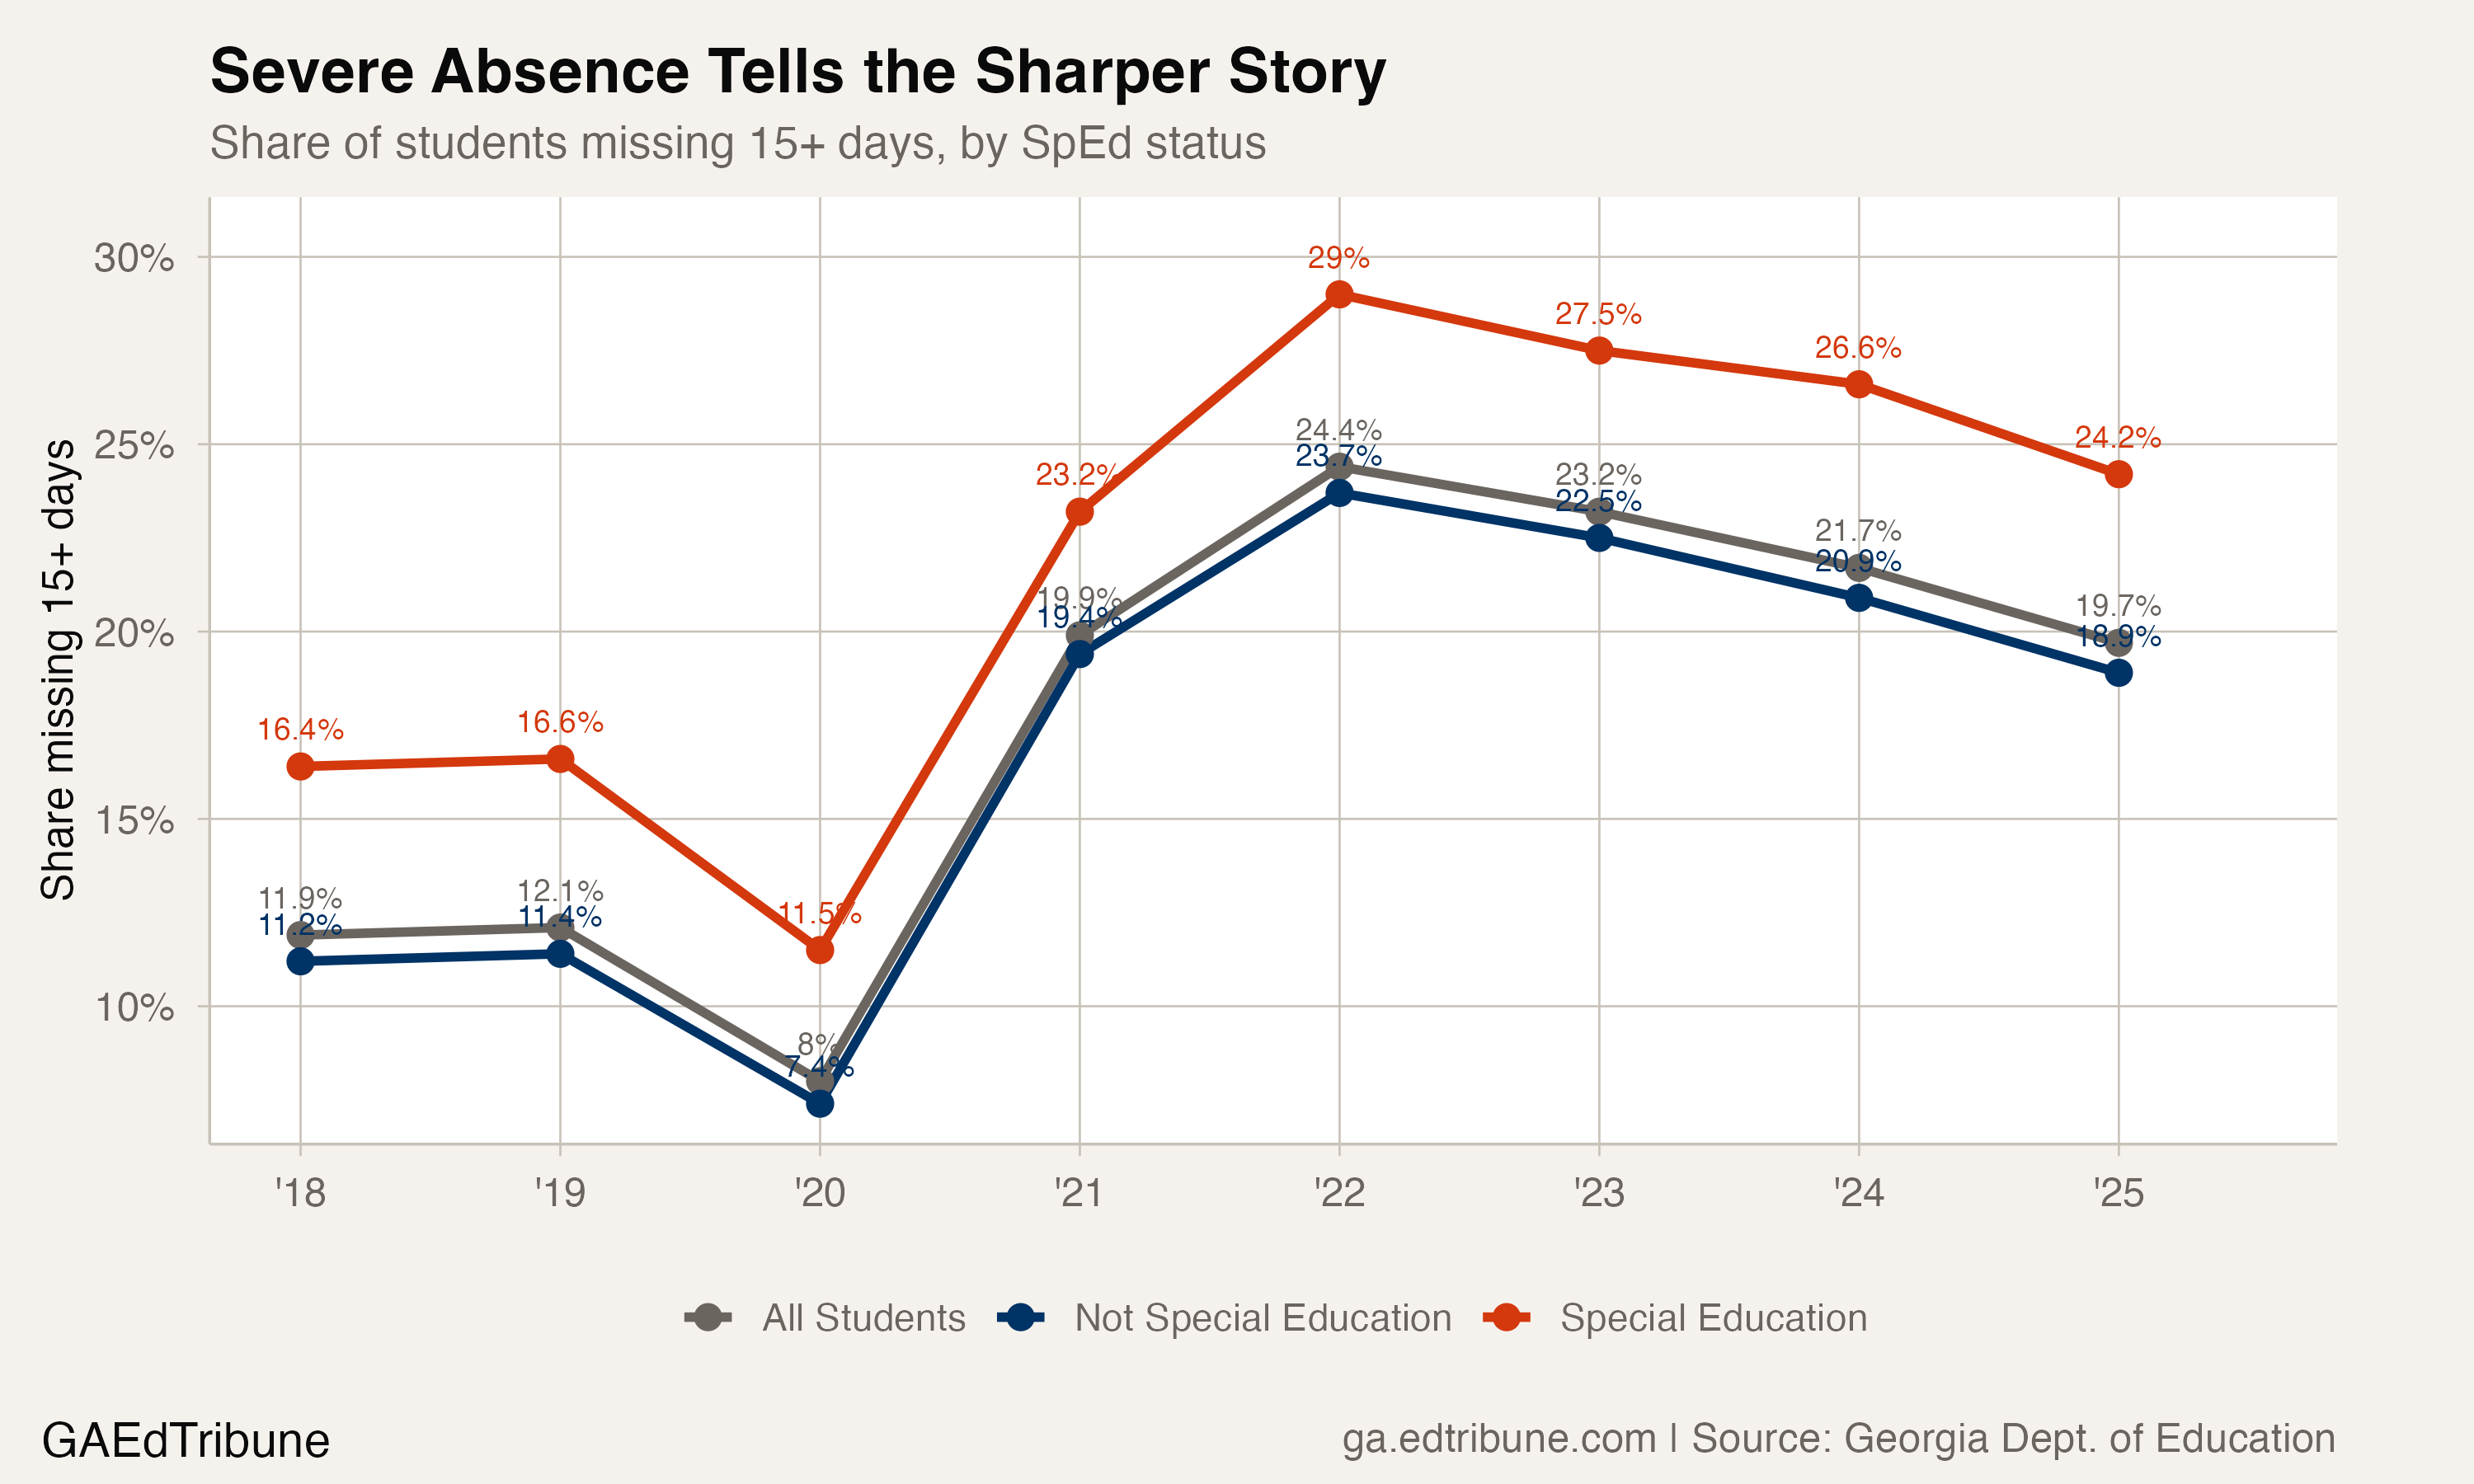
The attendance band data sharpens the picture. In 2024-25, 24.2% of special education students missed more than 15 days, compared to 18.9% of students without disabilities. The severe absence rate for students with disabilities peaked at 29.0% during 2021-22 and remains 7.6 percentage points above its pre-COVID level of 16.6%.
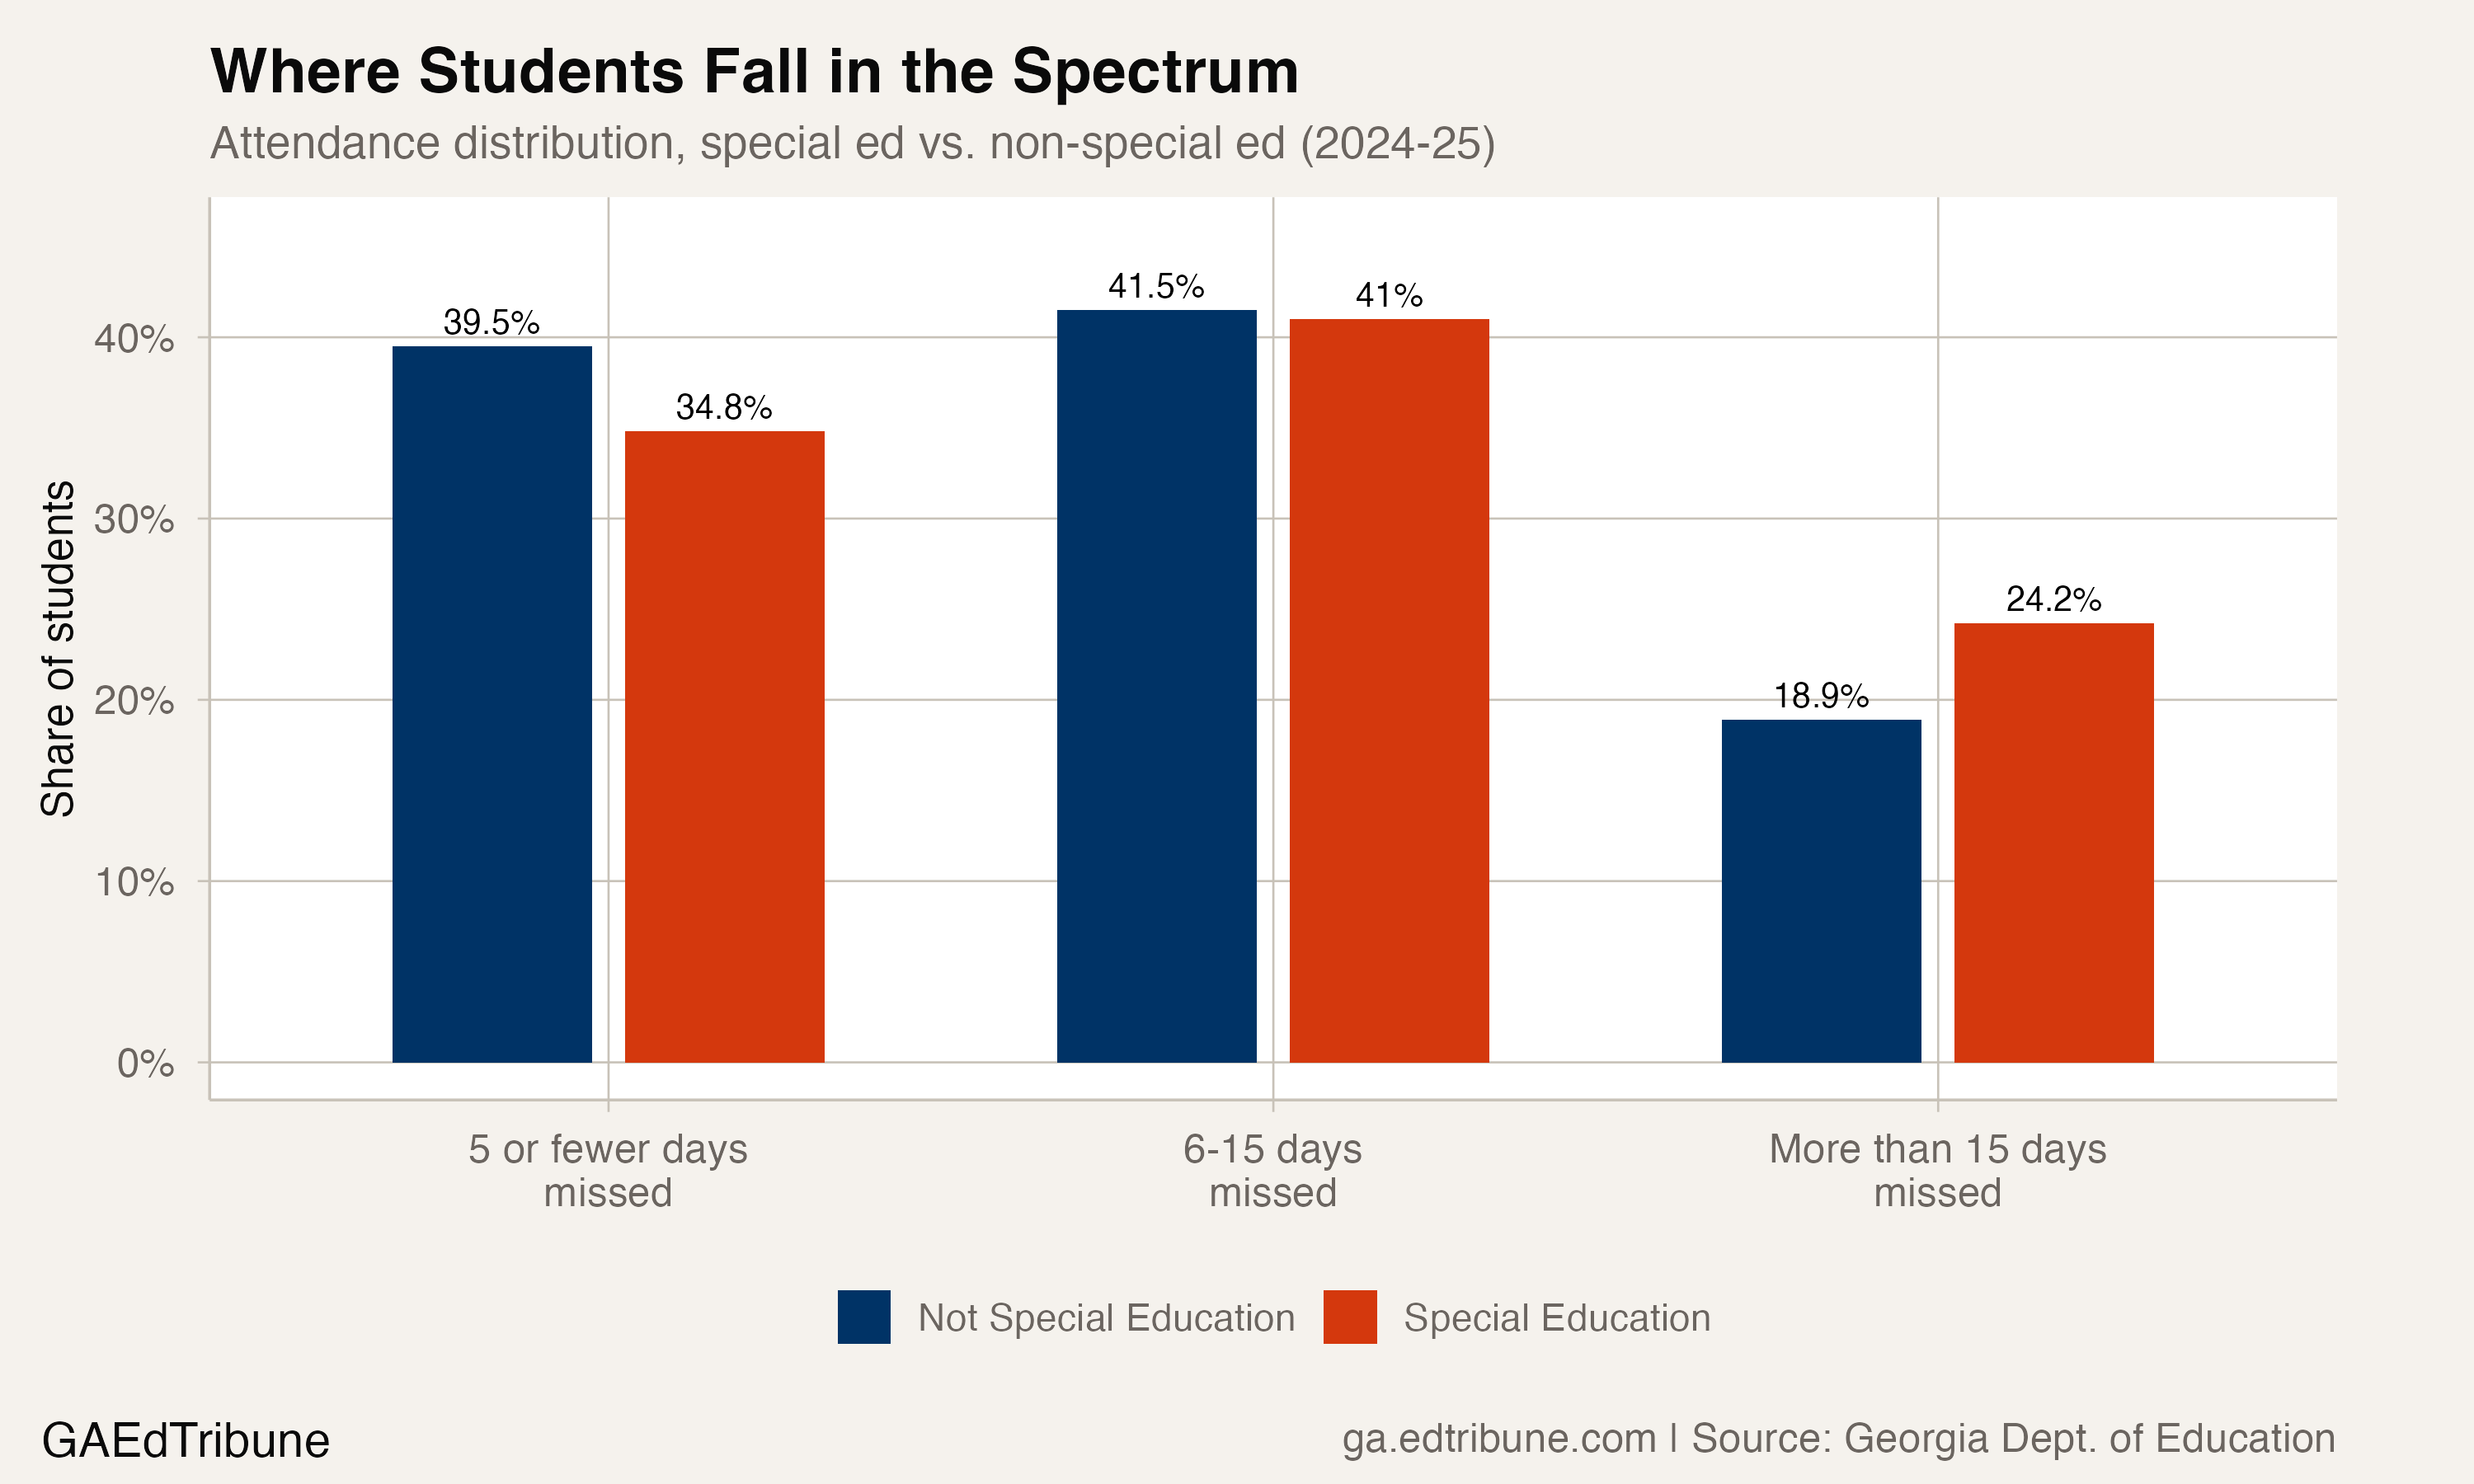
At the other end, only 34.8% of special education students had good attendance (five or fewer days missed), compared to 39.5% of their non-disabled peers. Before COVID, 45.6% of special education students hit that threshold. The entire distribution shifted.
Medical appointments, bus routes, and one psychologist per 6,390 students
Students with IEPs accumulate absences through channels that do not apply to most of their peers. Therapy appointments, specialist visits, and medical procedures pull students from the classroom on schedules that are medically necessary but educationally disruptive. A student who sees a speech therapist, an occupational therapist, and a pediatric neurologist outside of school can lose a day per week to appointments alone.
Transportation compounds the problem. Nationally, 38% of school transportation operators surveyed report that driver and aide shortages for special-needs routes are their greatest challenge. Georgia's bus driver shortage has been acute enough to prompt legislative proposals allowing non-bus vehicles for student transport, and Governor Kemp's 2025 budget increased the state's share of transportation costs from 17% to 40%. Students with disabilities, whose routes often require specialized vehicles and trained aides, are the most exposed when the system breaks down.
Then there is mental health. Georgia ranks 49th nationally in mental health care access, according to Mental Health America. The state funds one school psychologist for every 6,390 students; the recommended ratio is one per 500. Children can wait six to eight months for an adolescent behavioral health appointment. For students with emotional and behavioral disabilities, who are entitled to services under IDEA, the gap between what the IEP promises and what the mental health system can deliver often manifests as missed school days.
"State mental health care salaries should be increased by about 40%." -- Kevin Tanner, Georgia's behavioral health commissioner, Georgia Public Broadcasting, January 2024
That quote describes the labor market problem. Nearly one in four Georgia children ages 3-17 has an emotional, behavioral, or developmental condition. Only 44 of the state's 159 counties have adequate mental health providers.
The district map
Across Georgia's traditional school districts with at least 300 special education students, the range runs from 12.1% in Buford City to 41.6% in Decatur County, a 29.5-point spread. Among the state's largest districts, Atlanta Public Schools has the highest special education chronic absence rate at 37.5%, followed by Richmond County at 36.6% and Bibb County at 34.4%.
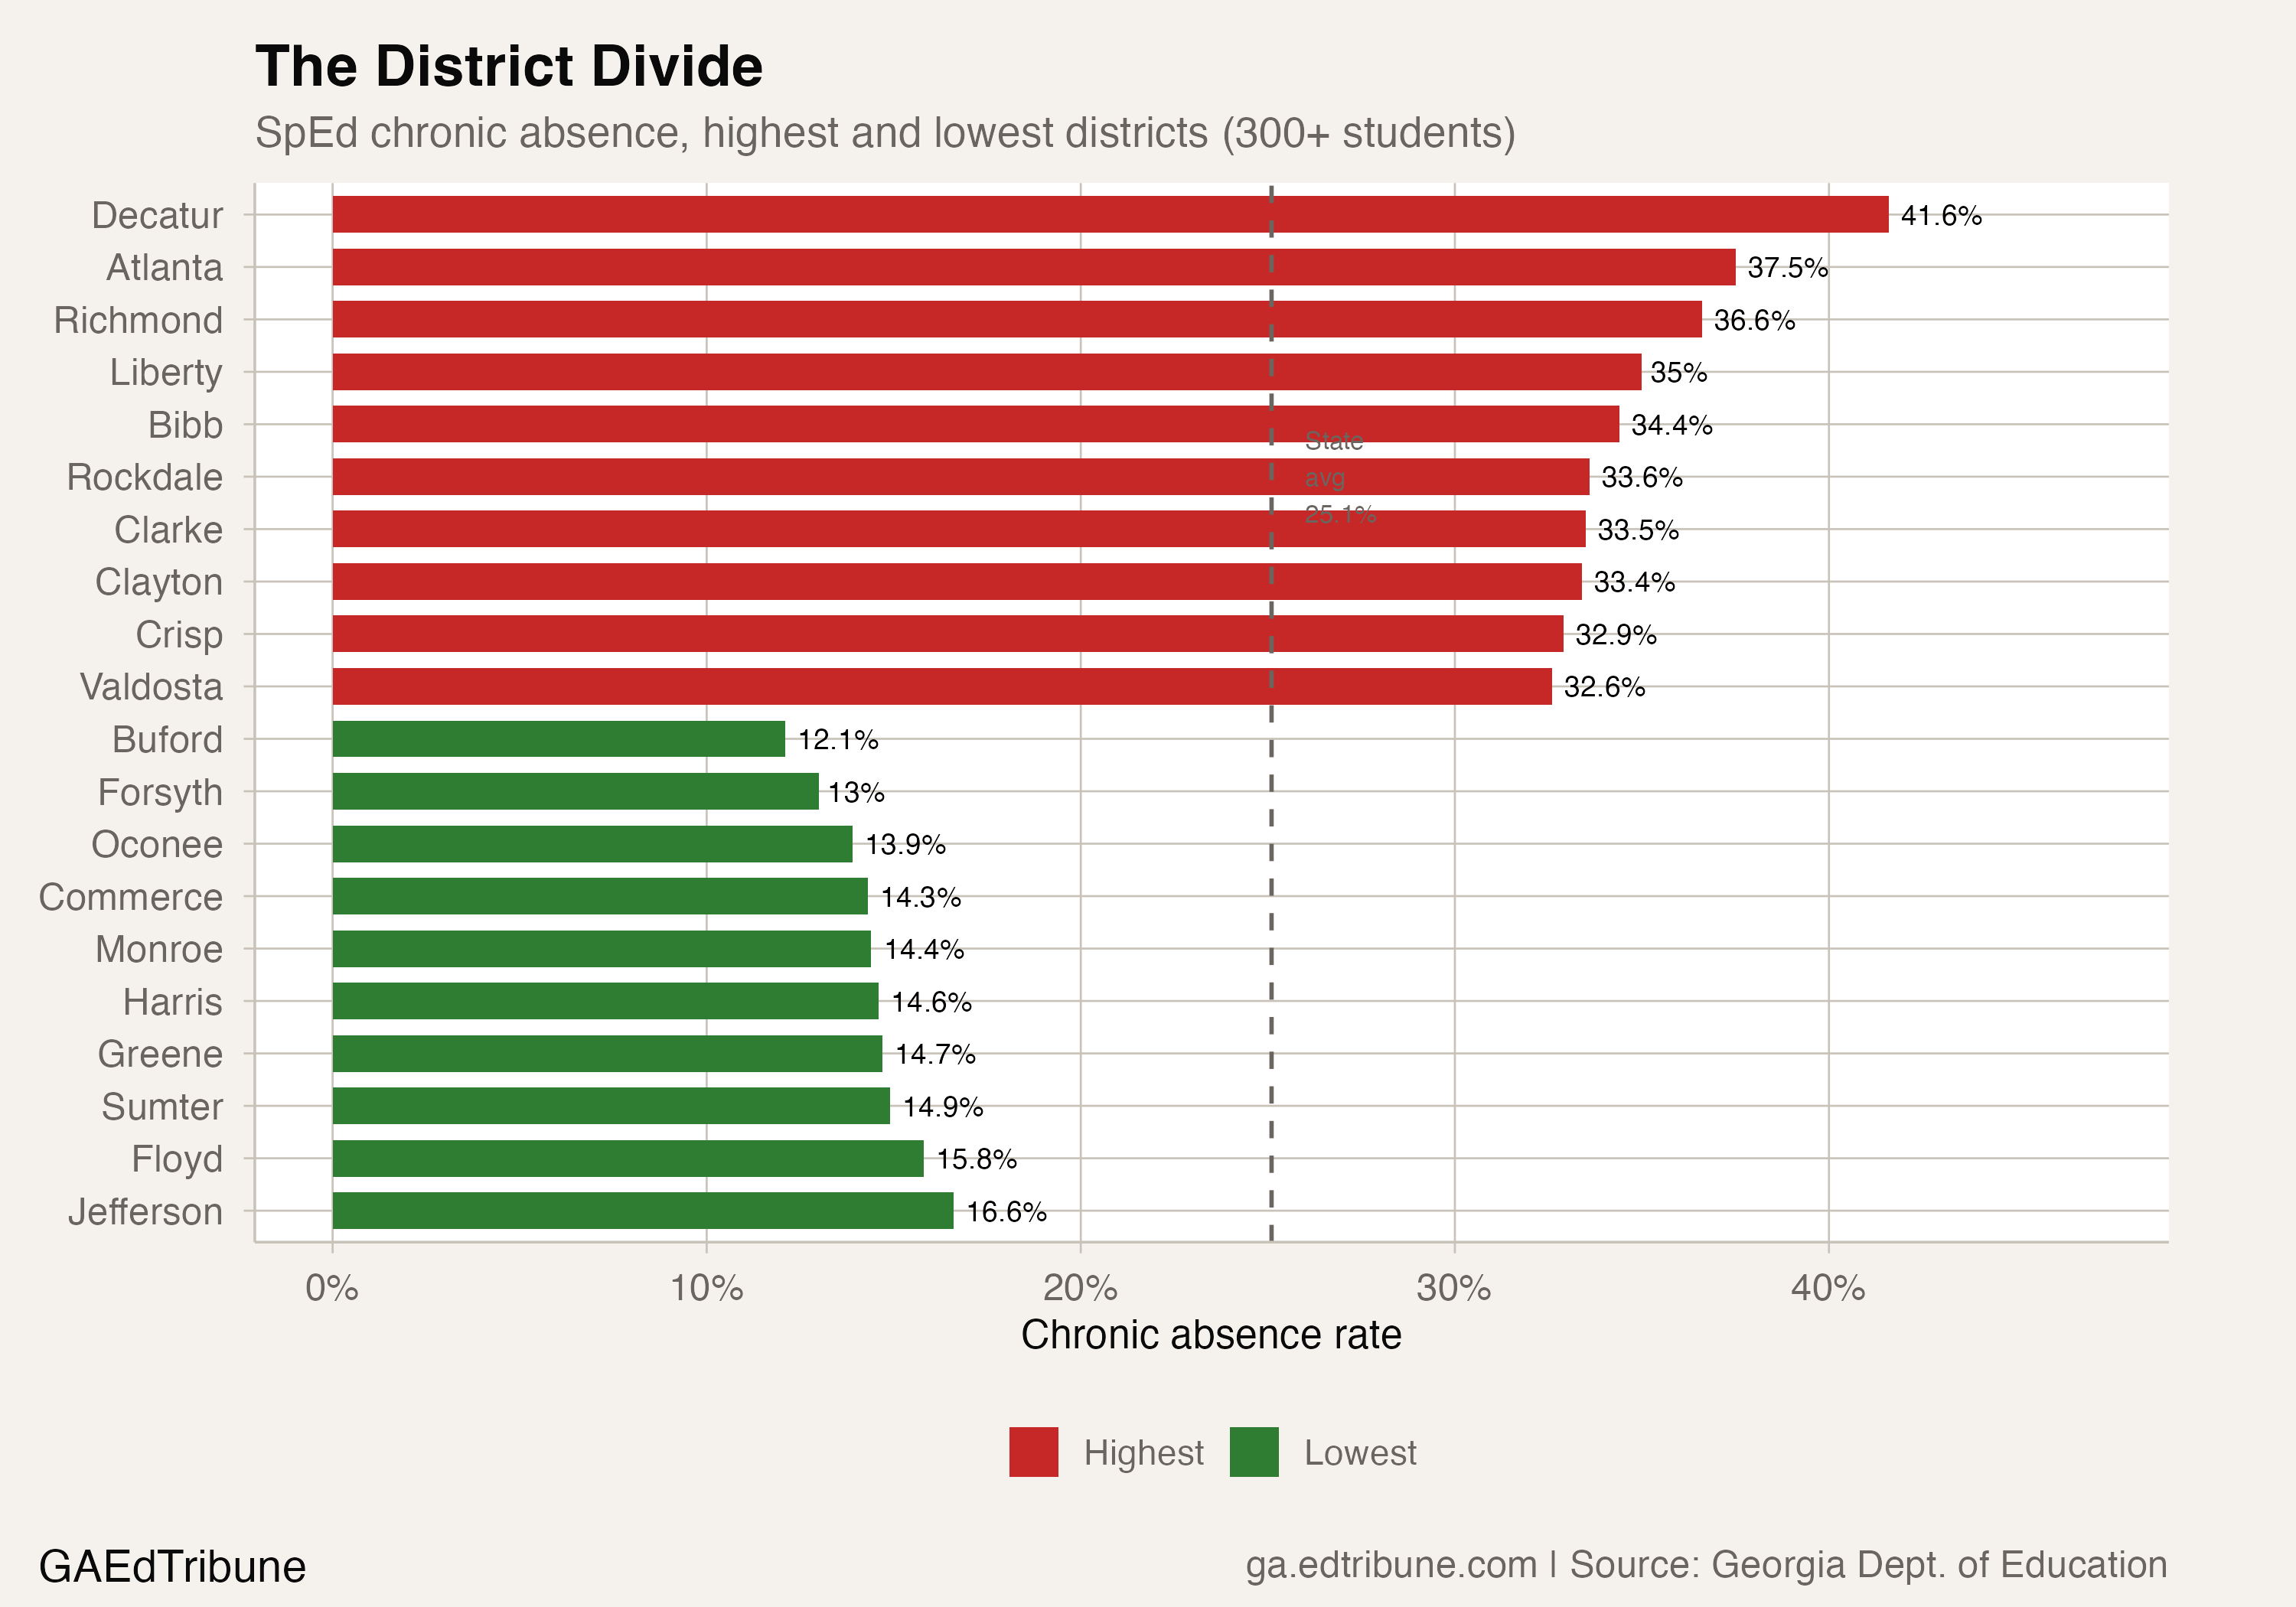
Forsyth County, one of the wealthiest districts in metro Atlanta, has a 13.0% special education chronic absence rate. Cherokee County, its suburban neighbor, sits at 19.6%. Both are below the state average. The pattern aligns with resources: districts with higher poverty rates, fewer specialists, and longer distances to medical providers tend to have higher special education absence rates.
The three credit-recovery charter schools tracked by the state (Mountain Education Center at 97.5%, Foothills Charter at 89.5%, and Coastal Plains Charter at 89.3%) are excluded from the district comparison. Their by-design flexible attendance models would distort any ranking.
What SB 123 does and does not do
Governor Kemp signed SB 123 on April 28, 2025, prohibiting schools from expelling students solely for absenteeism and requiring attendance review teams in districts where 10% or more of students are chronically absent. The law took effect July 1, 2025.
The legislation targets root causes: mental health, housing instability, unreliable transportation. Each county's student attendance committee was required to adopt a written attendance protocol by June 1, 2026. But SB 123 does not include disability-specific provisions. A student who misses school for a specialist appointment is not in the same category as a student who misses school because they feel disconnected, yet the attendance data counts them identically.
For special education students, the question is whether the attendance review teams will be equipped to distinguish between absences driven by the disability itself and absences driven by the same forces affecting all students. The 5.5-point gap has survived every policy intervention and every external shock Georgia's schools have experienced since 2018. The state's special education enrollment is growing, from 246,377 students in 2017-18 to 272,316 in 2024-25, a 10.5% increase. Each year there are more students in a system that has not closed the gap for the students already in it.
Detailed code that reproduces the analysis and figures in this article is available exclusively to EdTribune subscribers.
Discussion
Sign in to join the discussion.
Loading comments...