Correction (July 21, 2026): The original article misstated two Metro Atlanta peer gaps and the Hispanic endpoint improvement. It also attributed graduation-rate differences to leadership and programs that the aggregate cohort file cannot test, presented unavailable package years as a continuous annual series and wrote charts to obsolete April paths. This version corrects those issues and rebuilds the claim ledger and all five published charts from current state-package output.
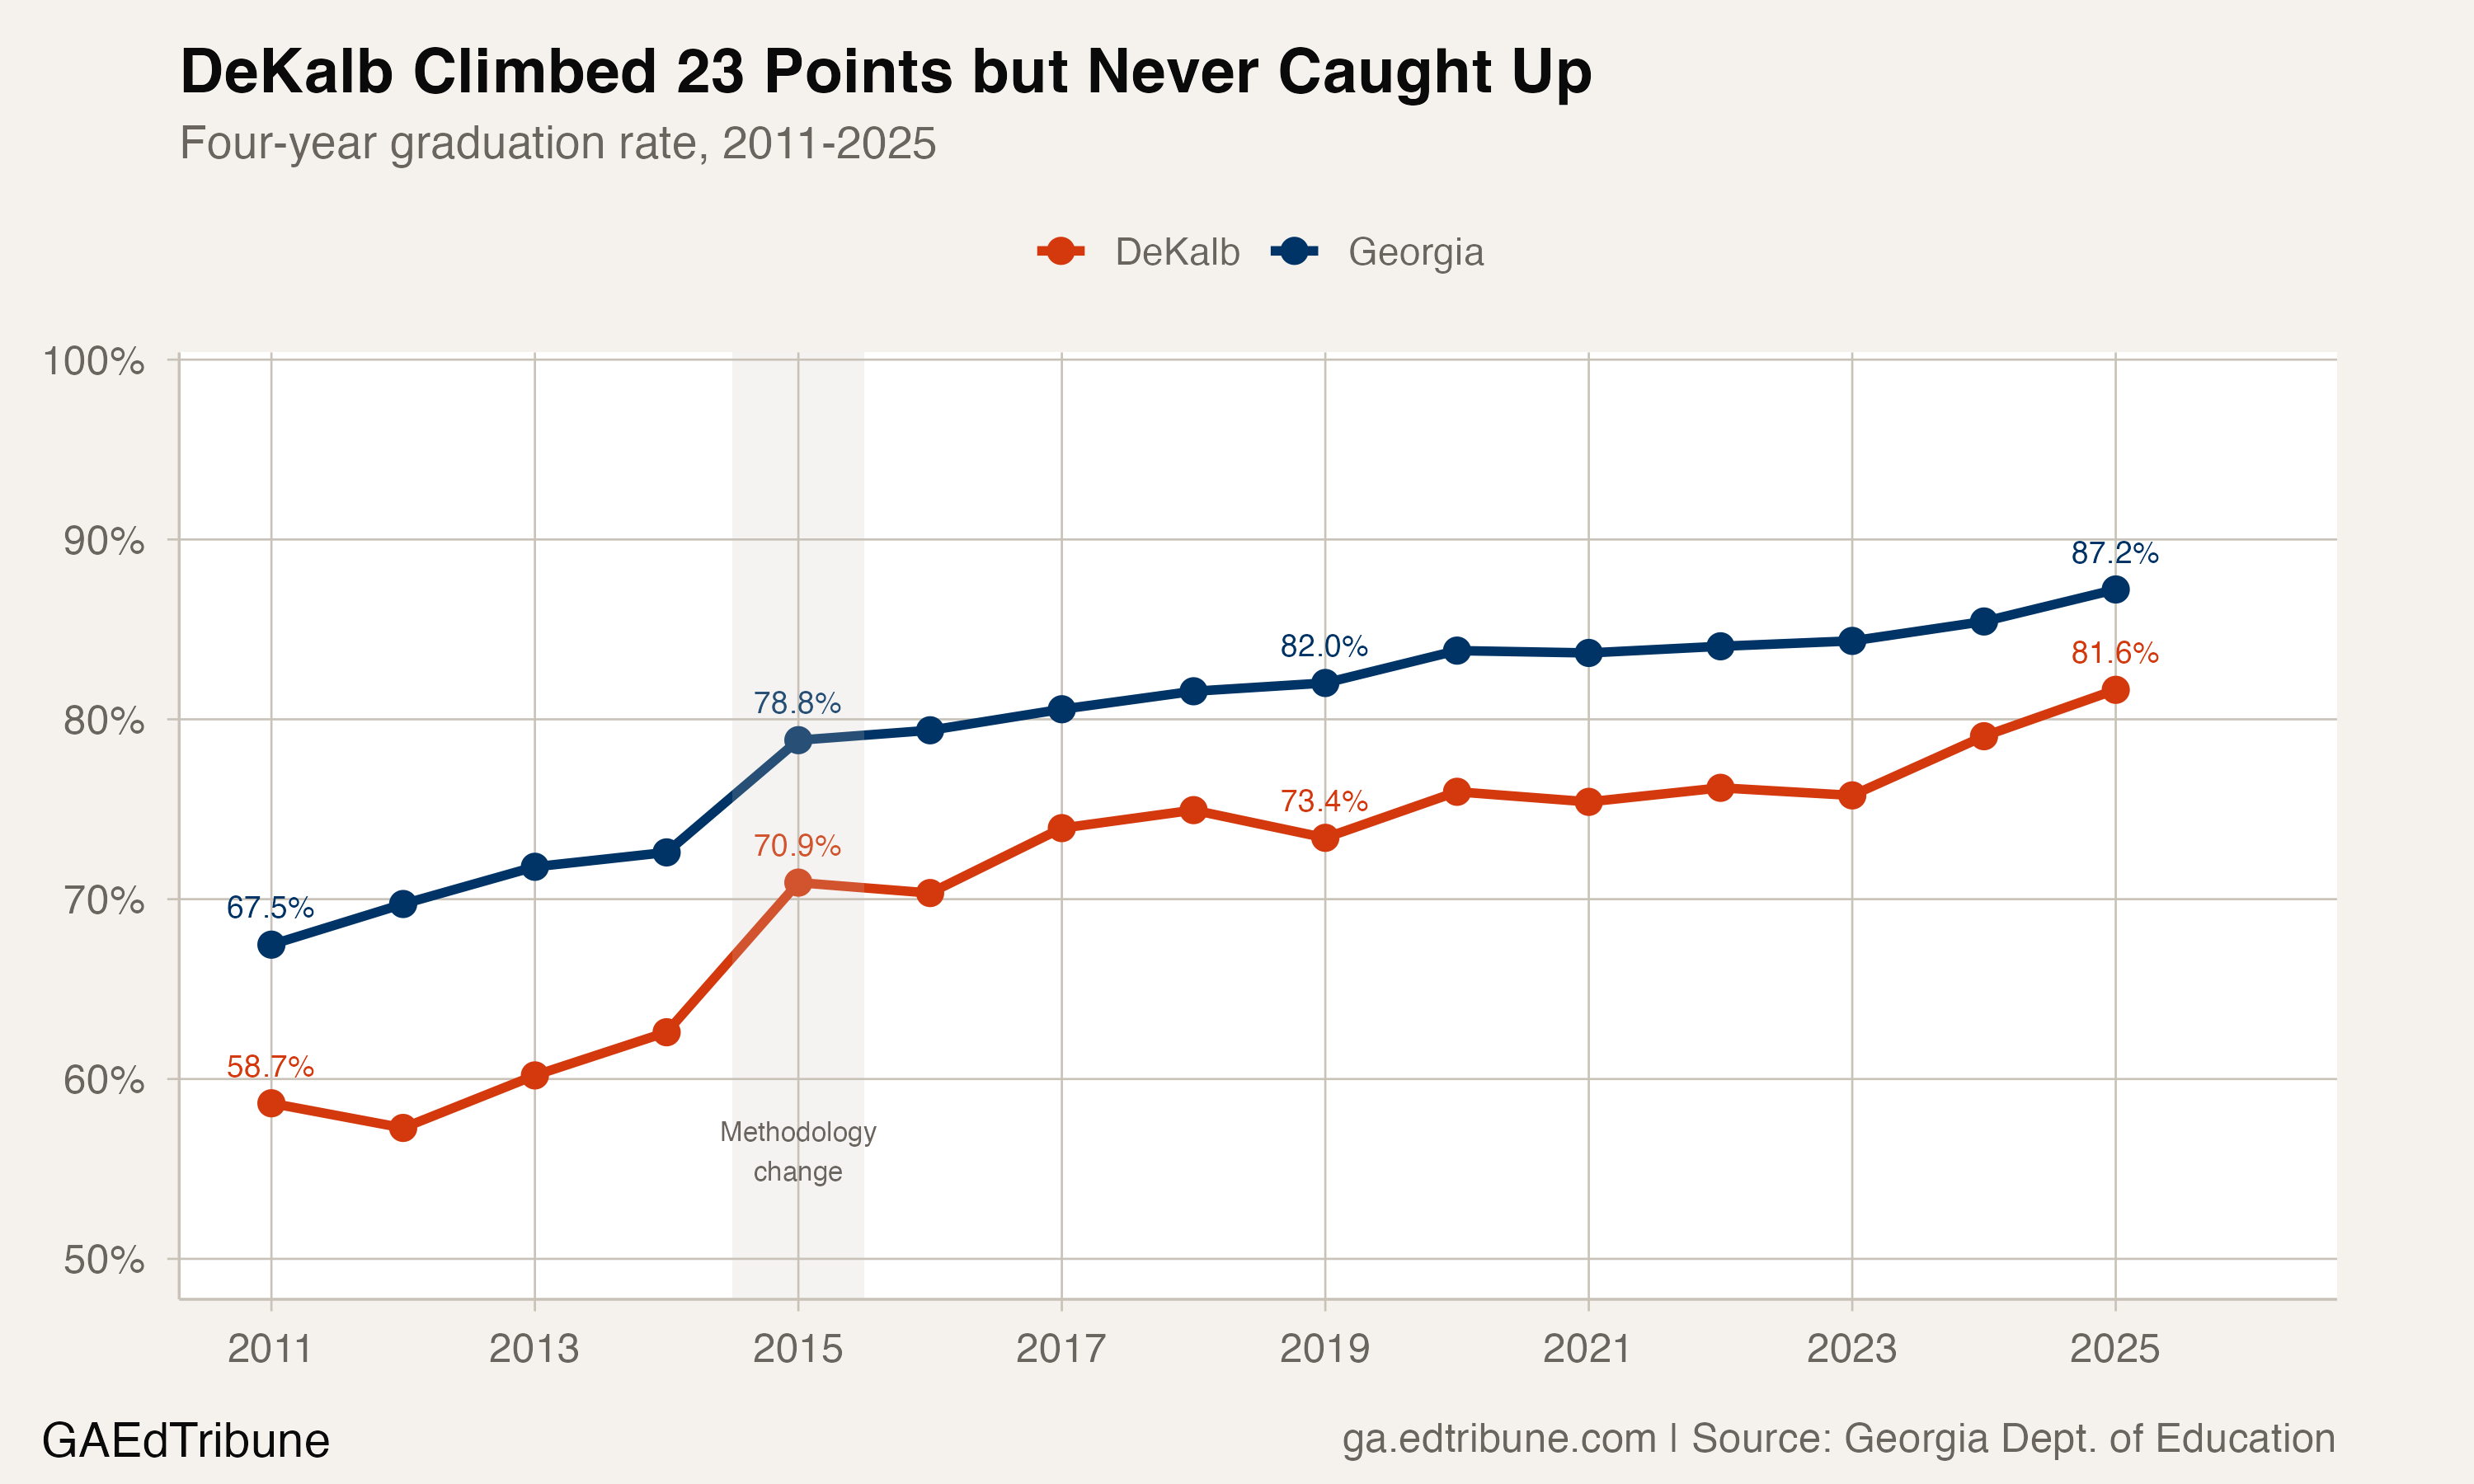
DeKalb County↗ET reported an 81.6% four-year graduation rate for its 2025 cohort of 6,940 students. The package's unrounded endpoints produced a 23.0-point gain from its 58.7% rate for a cohort of 8,169 in 2011.
The current package query returned DeKalb rows for 2011 and every year from 2018 through 2025. It returned no district rows for 2012 through 2017, so the trend chart shows that interval as a gap rather than connecting it as an annual series.
Last in the Metro Comparison
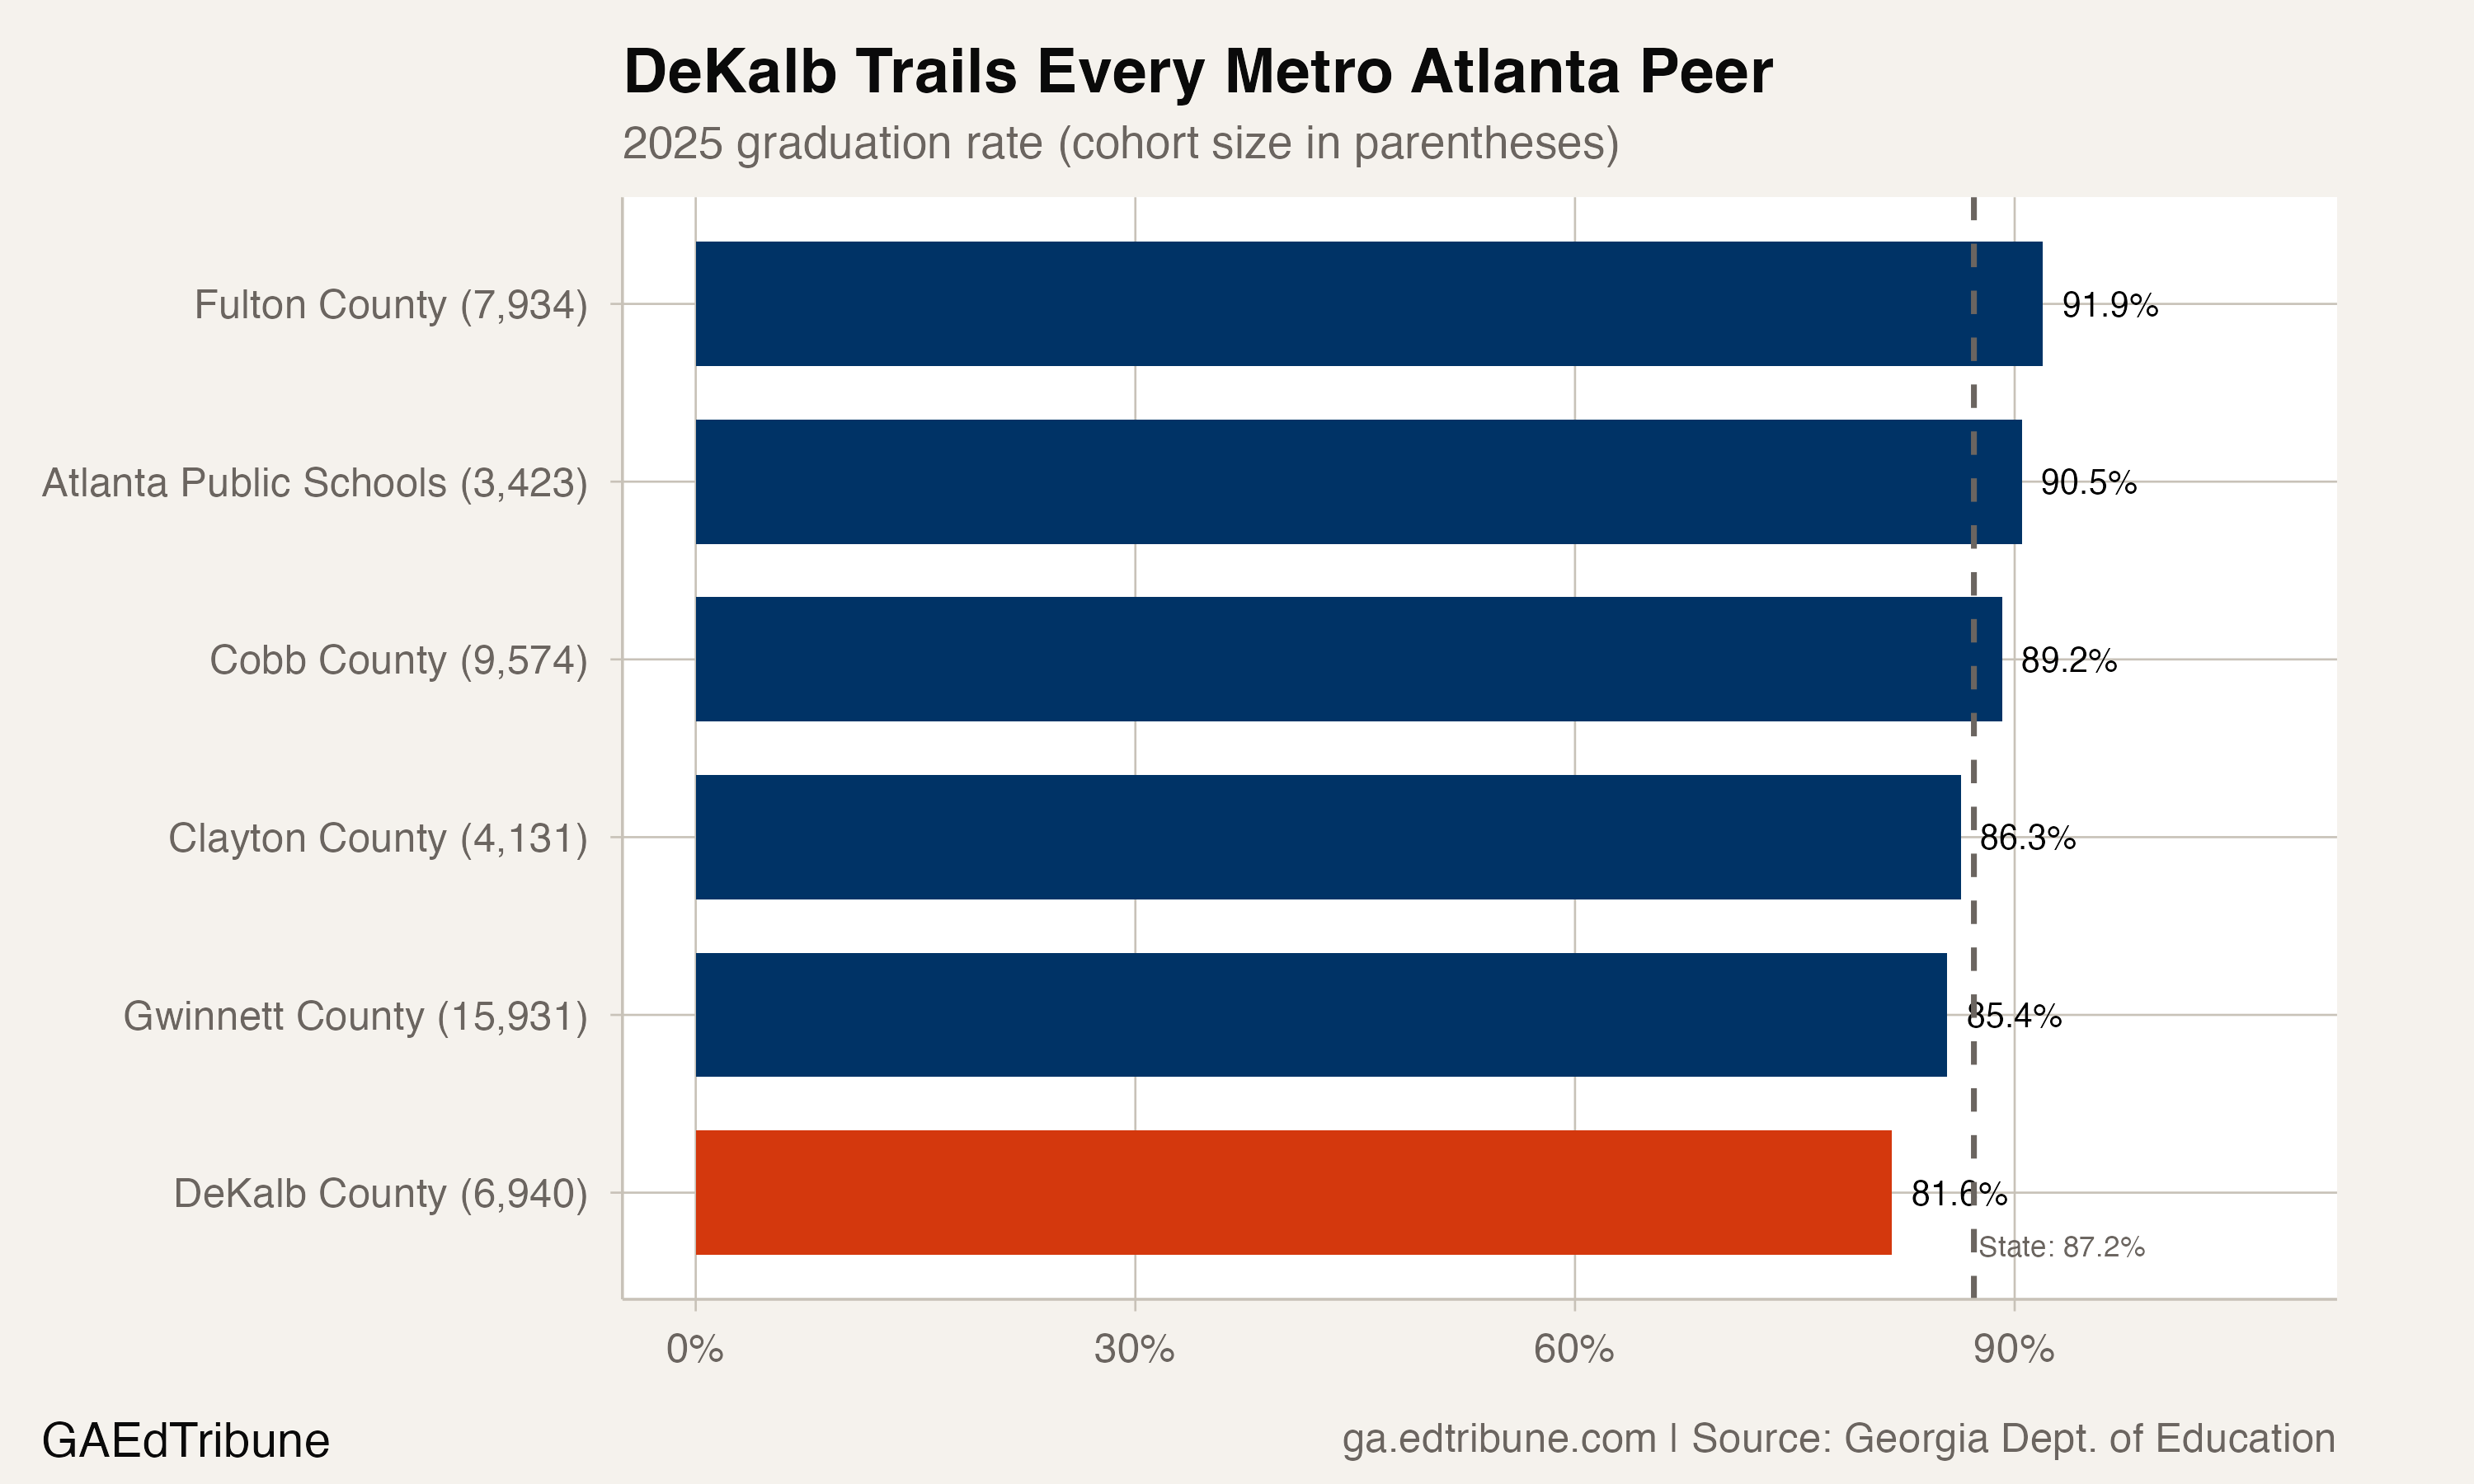
DeKalb ranked last in the six-district Metro Atlanta panel in 2025. Gwinnett County↗ET was at 85.4%, 3.8 points above DeKalb. Clayton County↗ET was at 86.3%, a 4.7-point gap. Cobb County↗ET was at 89.2%, 7.5 points higher.
Atlanta Public Schools↗ET reported 90.5%, an 8.8-point gap, and Fulton County↗ET reported 91.9%, a 10.3-point gap. Georgia's statewide rate was 87.2%, leaving DeKalb 5.6 points below the state.
A Narrow Range, Then Two Gains
From 2019 through 2023, DeKalb's reported rate stayed between 73.4% and 76.2%. It was 73.4% in 2019 and 75.8% in 2023. Over the same endpoints, Georgia moved from 82.0% to 84.4%, leaving DeKalb about 8.6 points behind in both years.
DeKalb then rose 3.3 points to 79.1% in 2024 and another 2.6 points to 81.6% in 2025. The endpoint gain from 2023 to 2025 was 5.9 points.
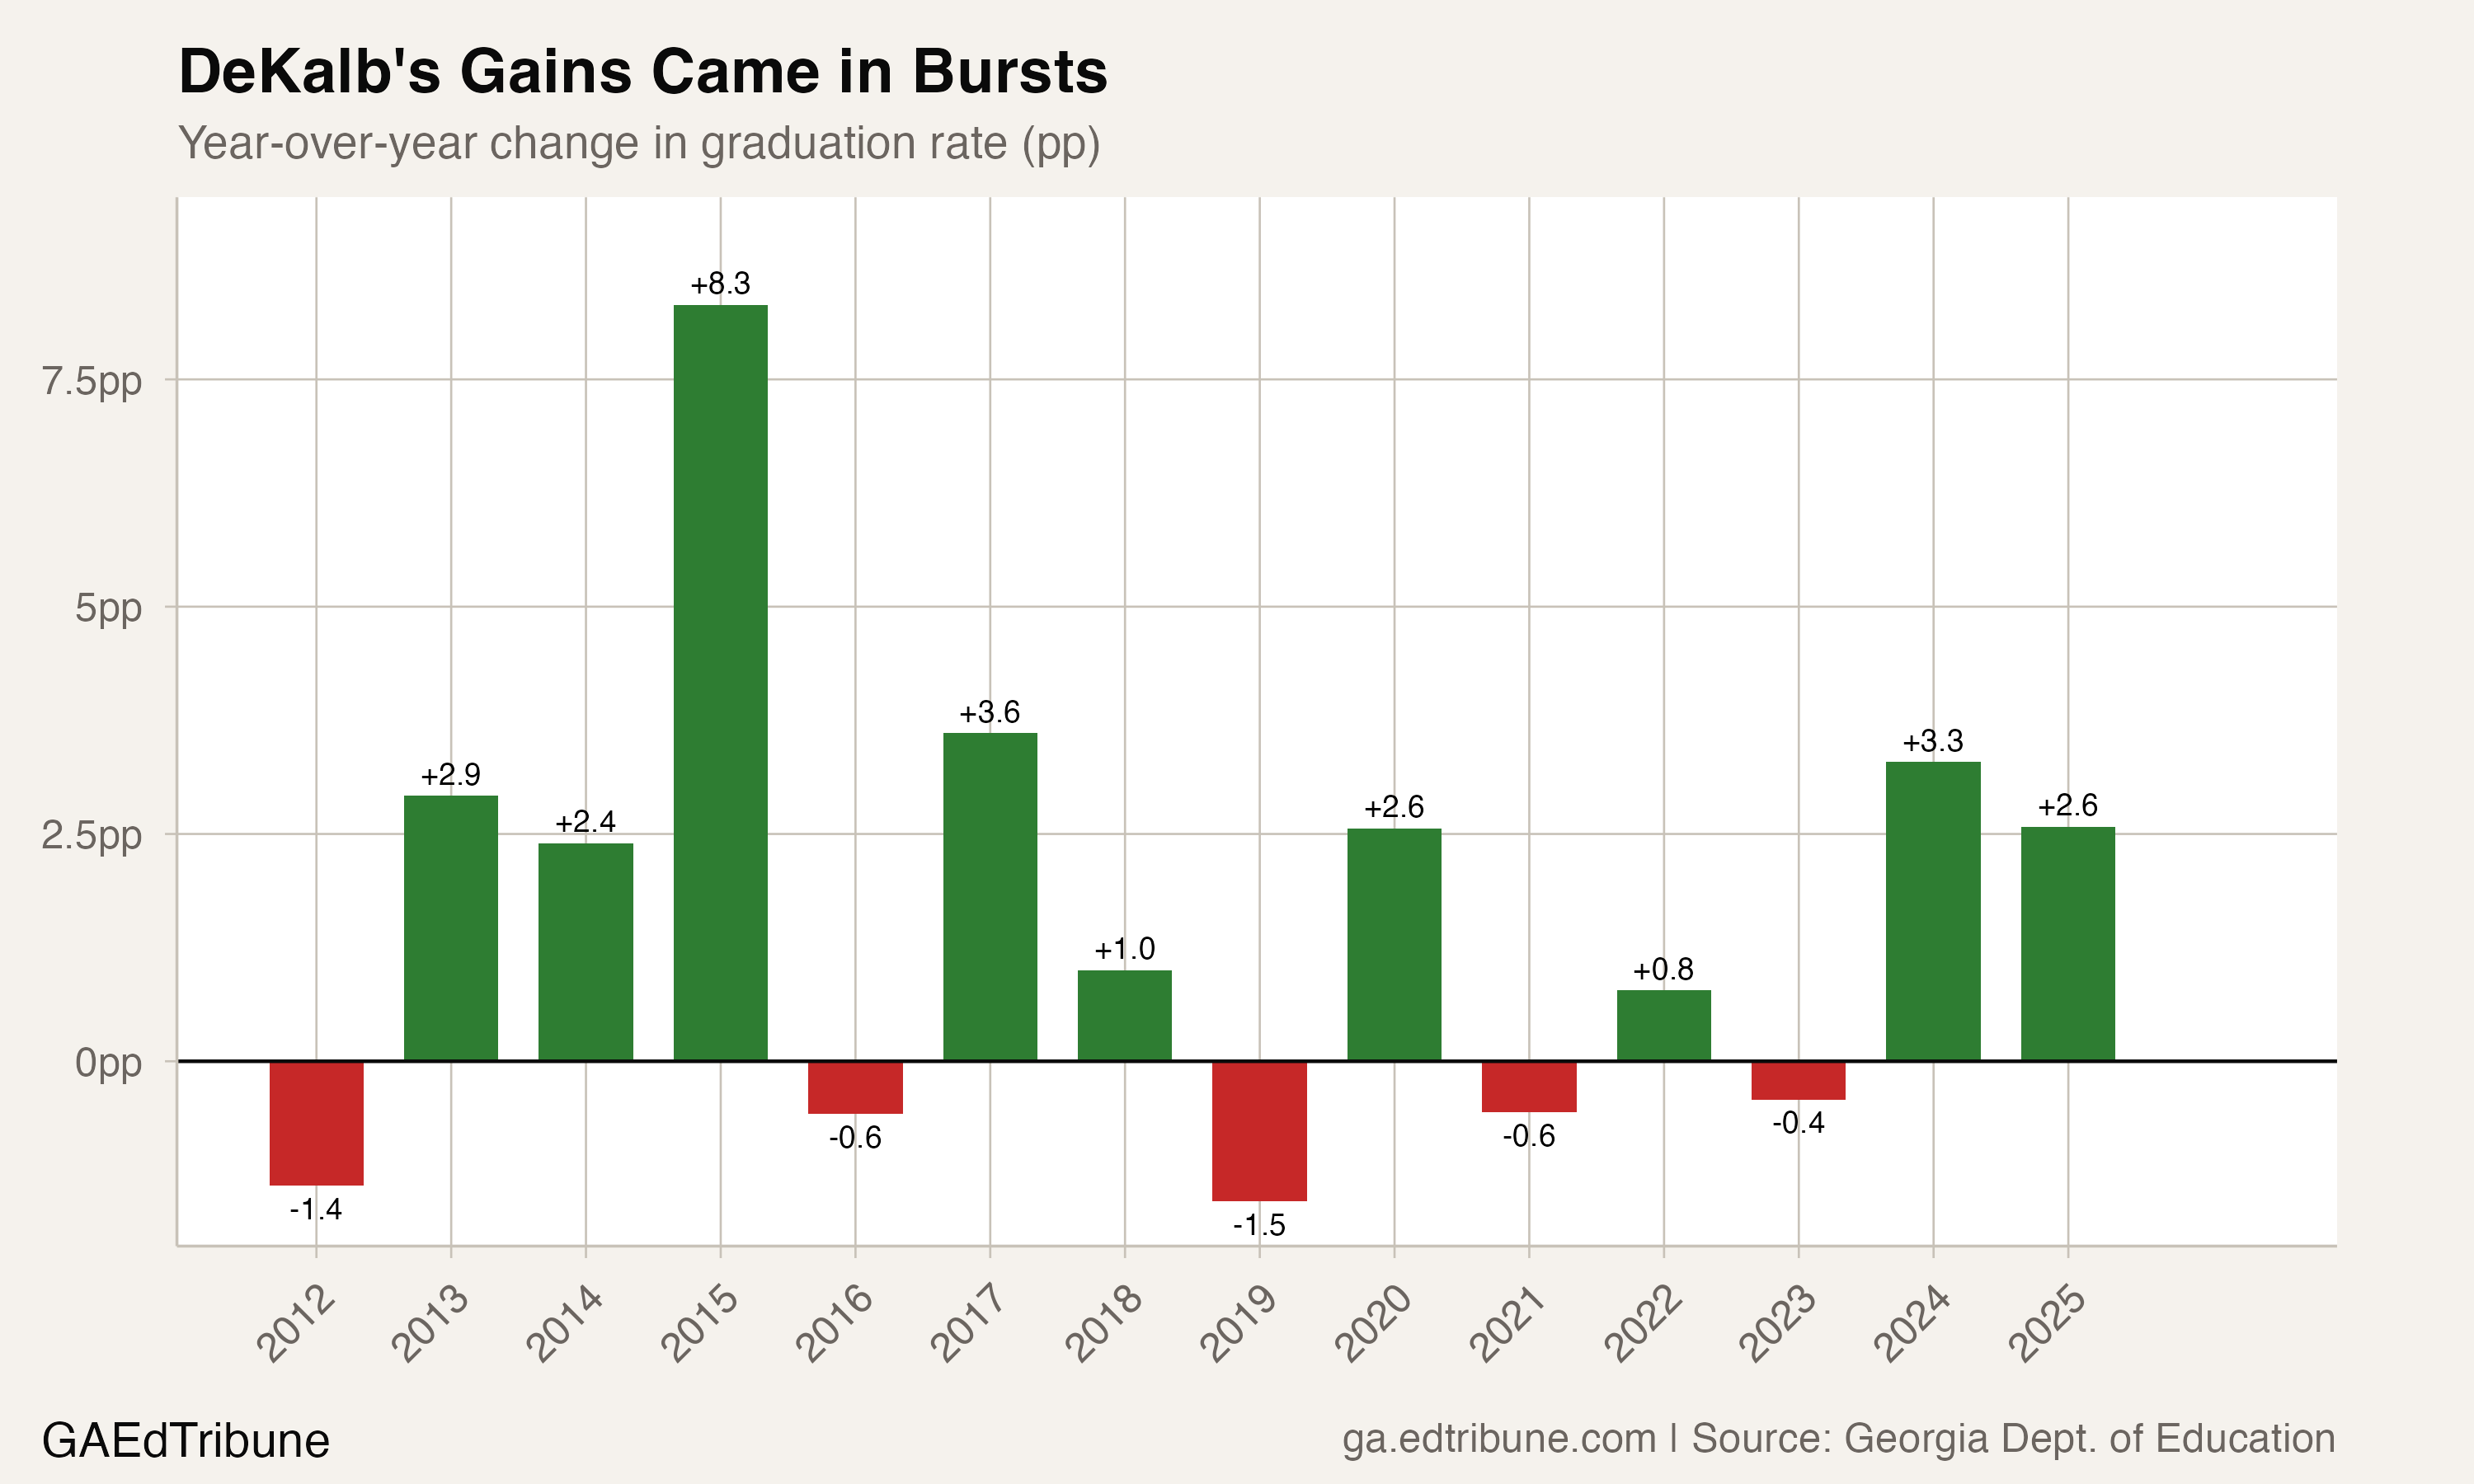
The cohort file establishes those changes but does not identify whether leadership, specific programs, facilities, student composition or other factors caused them.
Clayton Moved From Behind to Ahead
In 2011, Clayton's 51.5% rate was 7.2 points below DeKalb's 58.7%. By 2025, Clayton was at 86.3%, 4.7 points above DeKalb's 81.6%. Across those reported endpoints, Clayton gained 34.8 points while DeKalb gained 23.0.
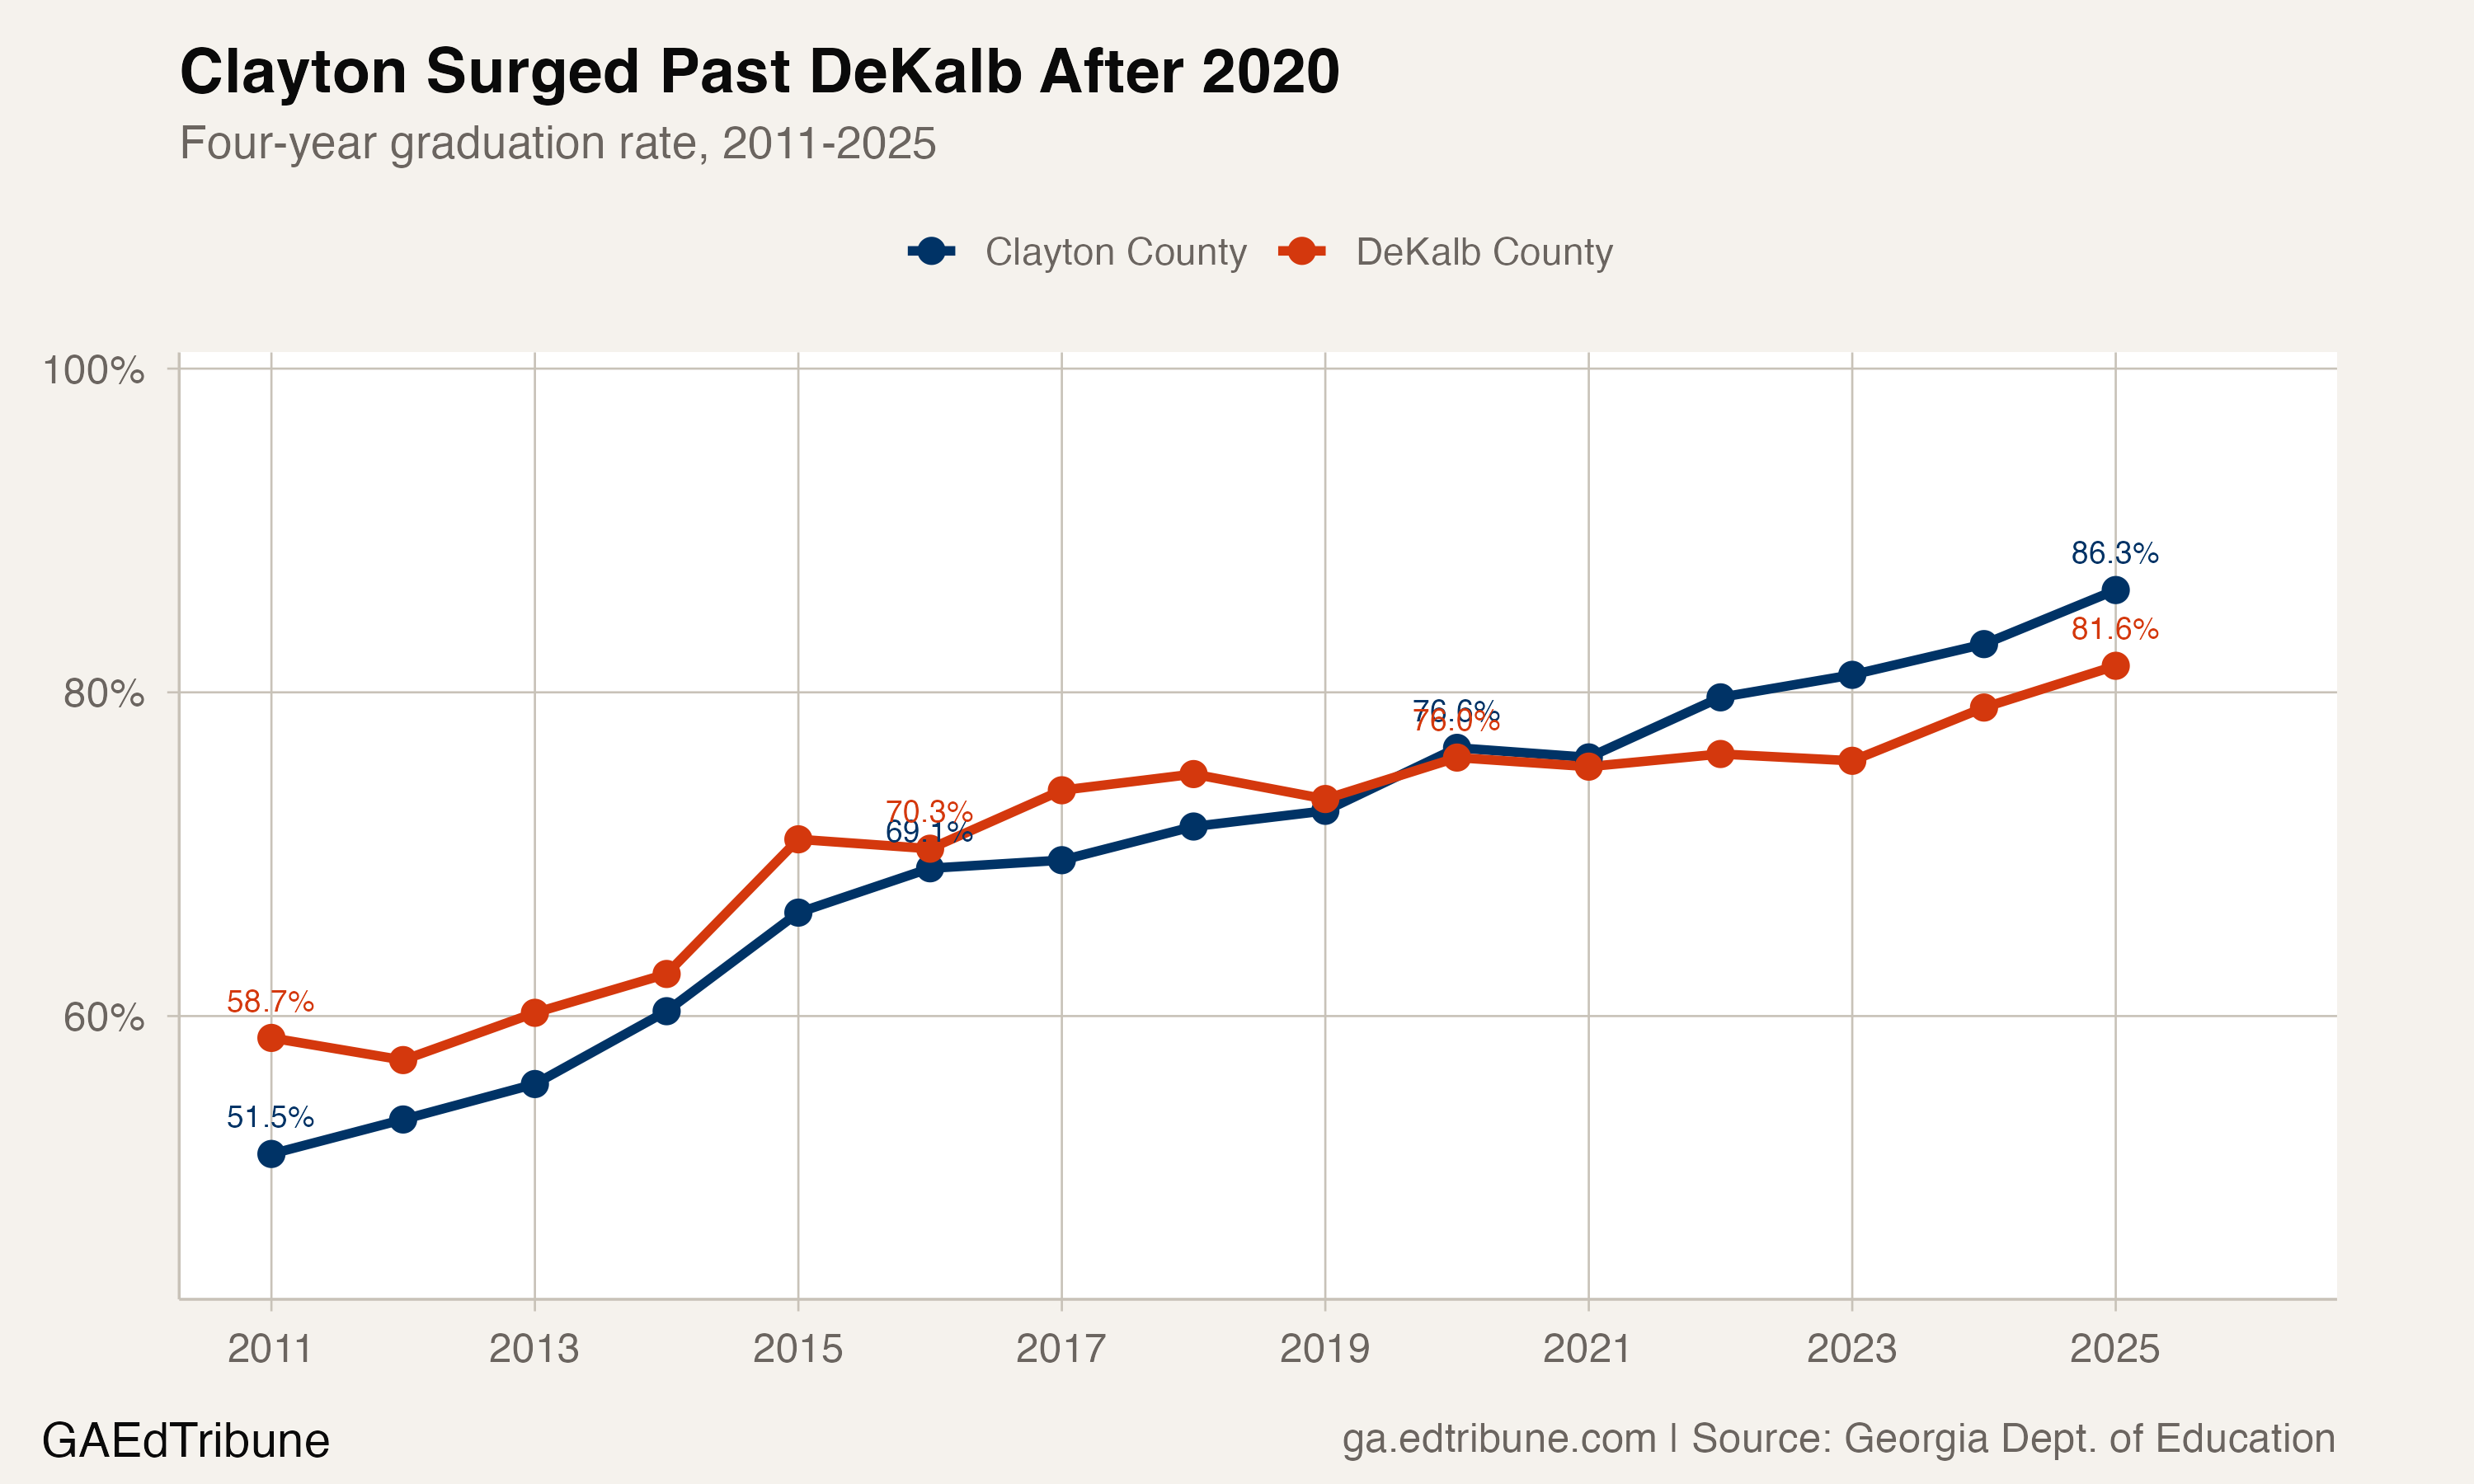
That comparison describes different district trajectories. It does not isolate the reason for the difference or establish that a particular policy produced either result.
Subgroup Rates
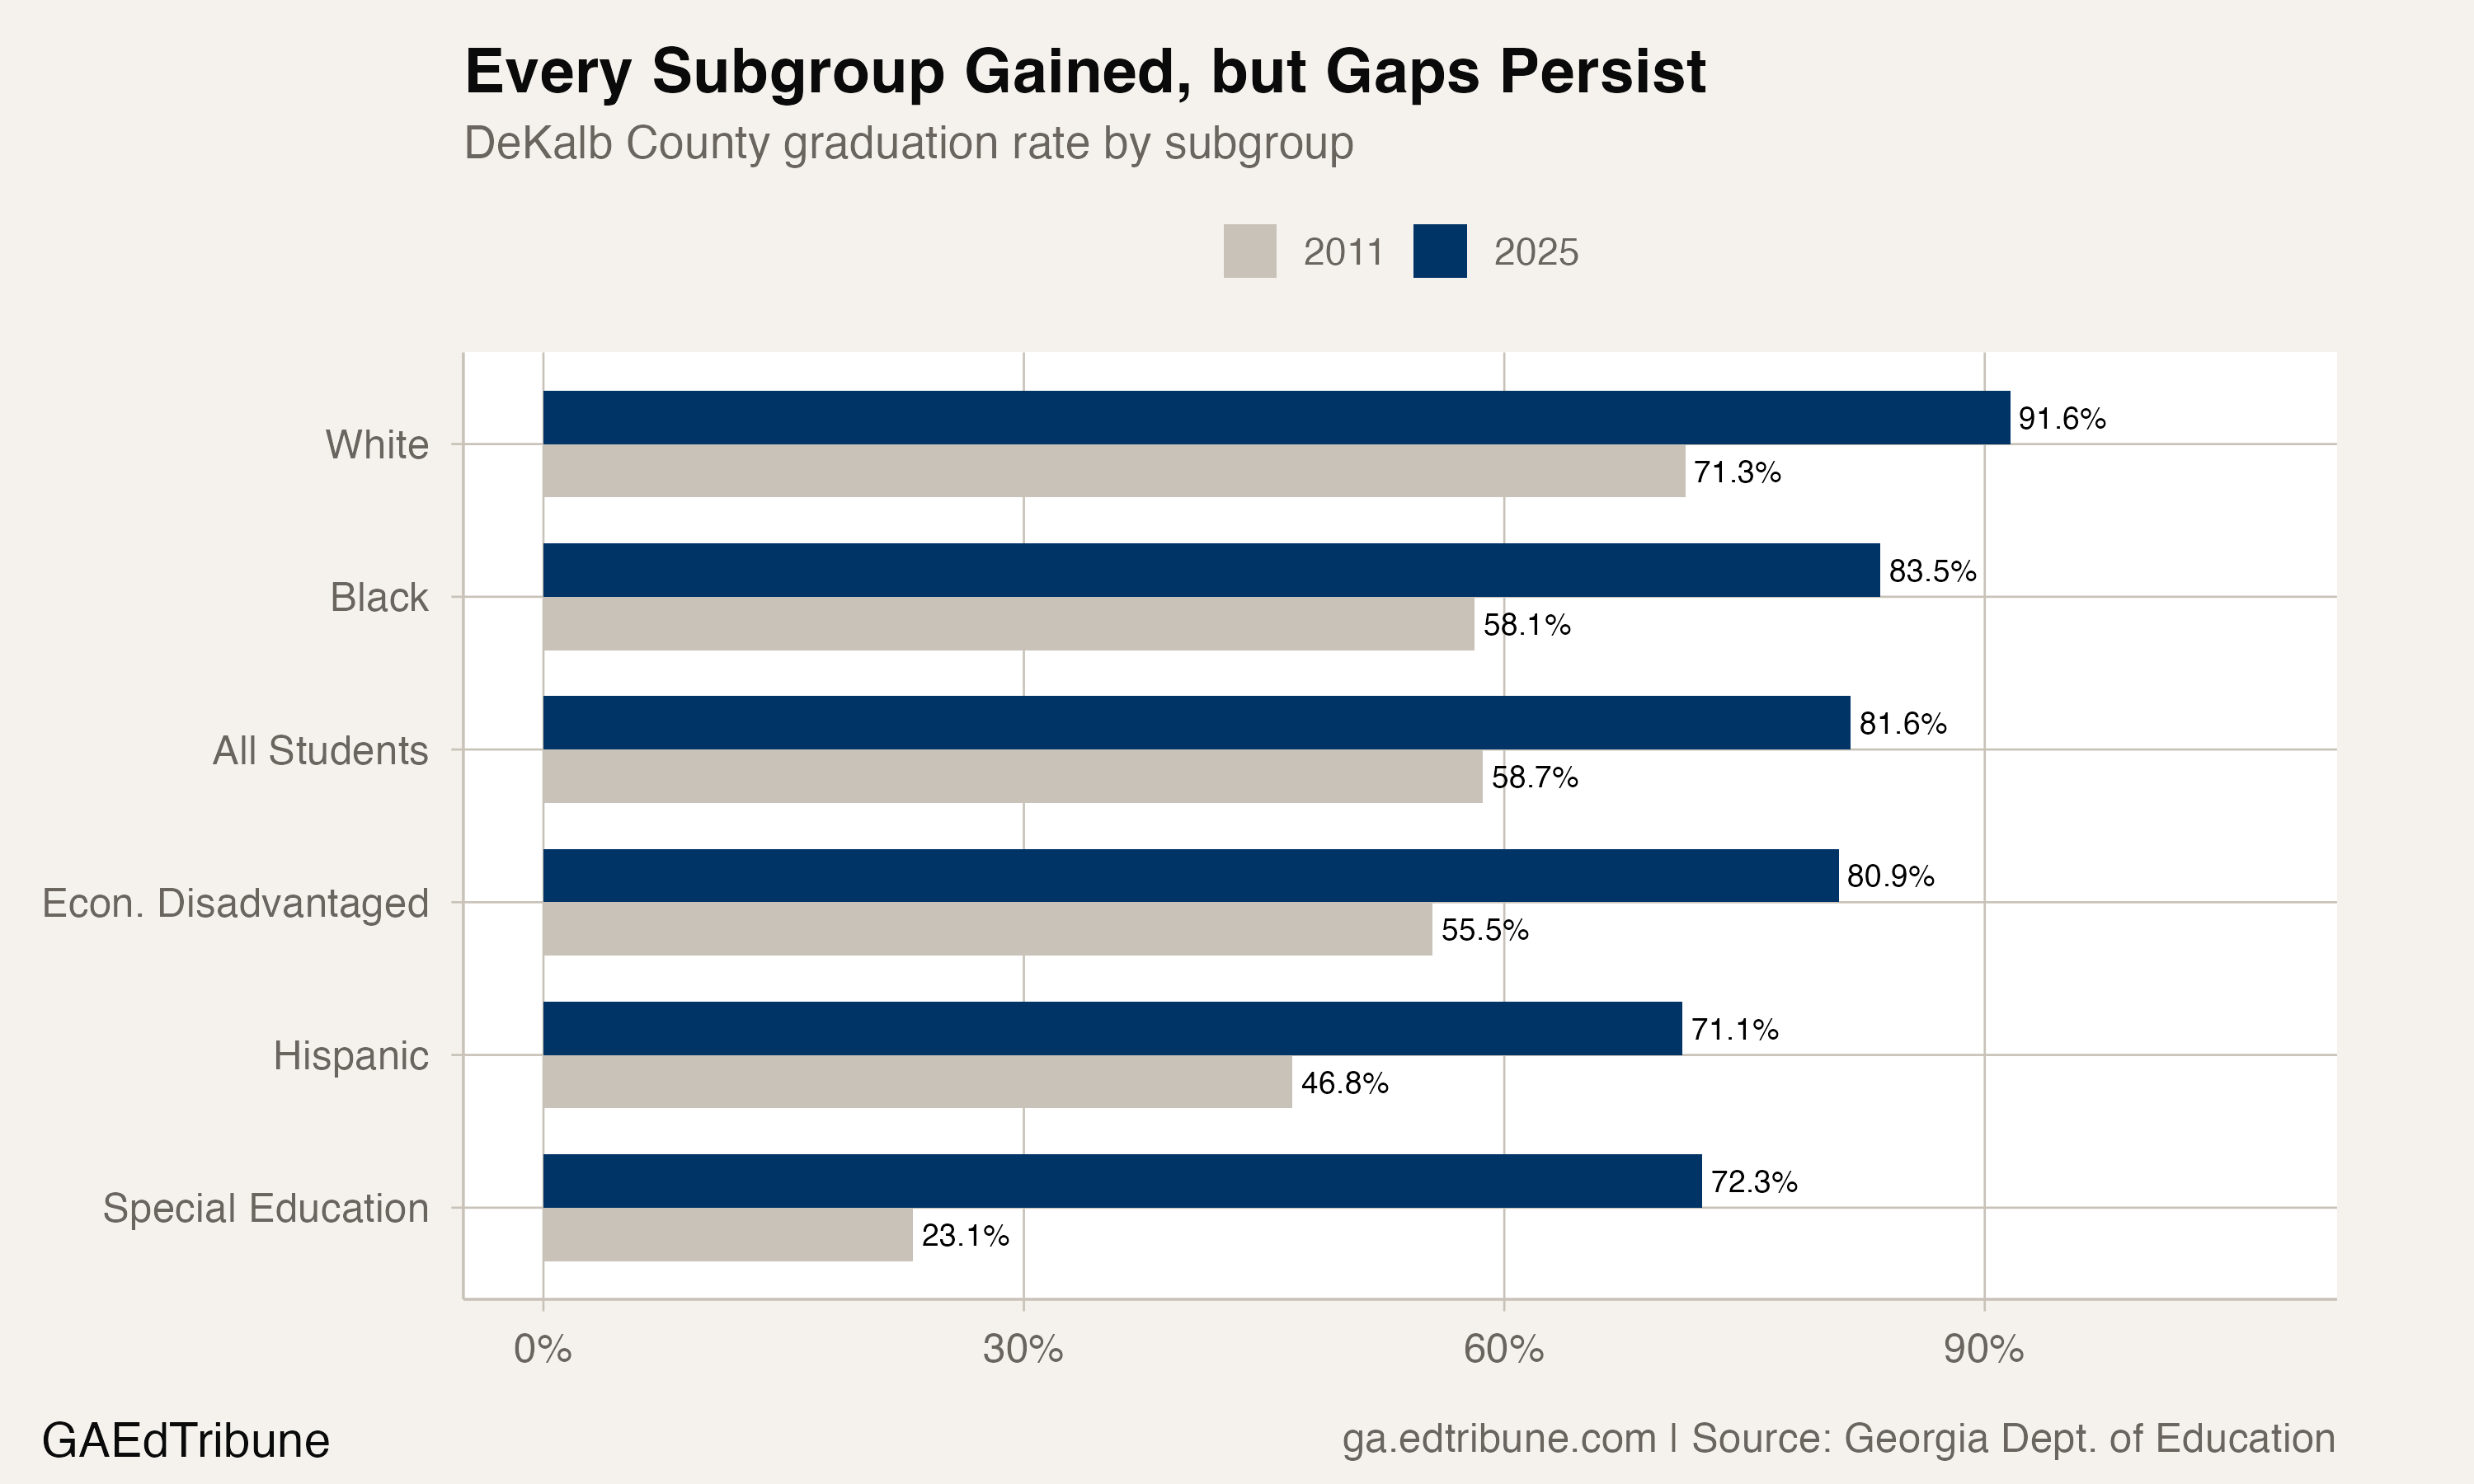
Black students accounted for 4,111 of DeKalb's 6,940 students in the 2025 cohort, or 59.2%, and had an 83.5% graduation rate. Hispanic students accounted for 1,506 students, or 21.7%, and had a 71.1% rate. The Hispanic rate was 10.5 points below DeKalb overall and 16.1 points below the state.
The Hispanic cohort grew from 586 students in 2011 to 1,506 in 2025, a 157% increase, while its graduation rate rose from 46.8% to 71.1%, a 24.4-point gain. Those aggregate cohorts do not track the same students over time.
Students receiving special education services rose from 23.1% in 2011 to 72.3% in 2025, a 49.3-point gain from the package's unrounded rates. The latest cohort included 828 students, and its rate remained 9.3 points below DeKalb overall. The district's other reported 2025 rates included 80.9% for economically disadvantaged students and 91.6% for white students.
Applying the package's cohort rates to its cohort counts yields an estimated 3,378 non-graduates in 2011 and 1,274 in 2025, a reduction of 2,104. Those are derived estimates from the reported rates, not student-level outcome records.
Detailed code that reproduces the analysis and figures in this article is available exclusively to EdTribune subscribers.
Discussion
Sign in to join the discussion.
Loading comments...