Correction: An earlier draft mislabeled free- or reduced-price lunch eligibility as economic disadvantage and overstated what the attendance data could establish about causes. The analysis and charts were rebuilt with the source metric's exact label and separate outcomes from possible explanations.
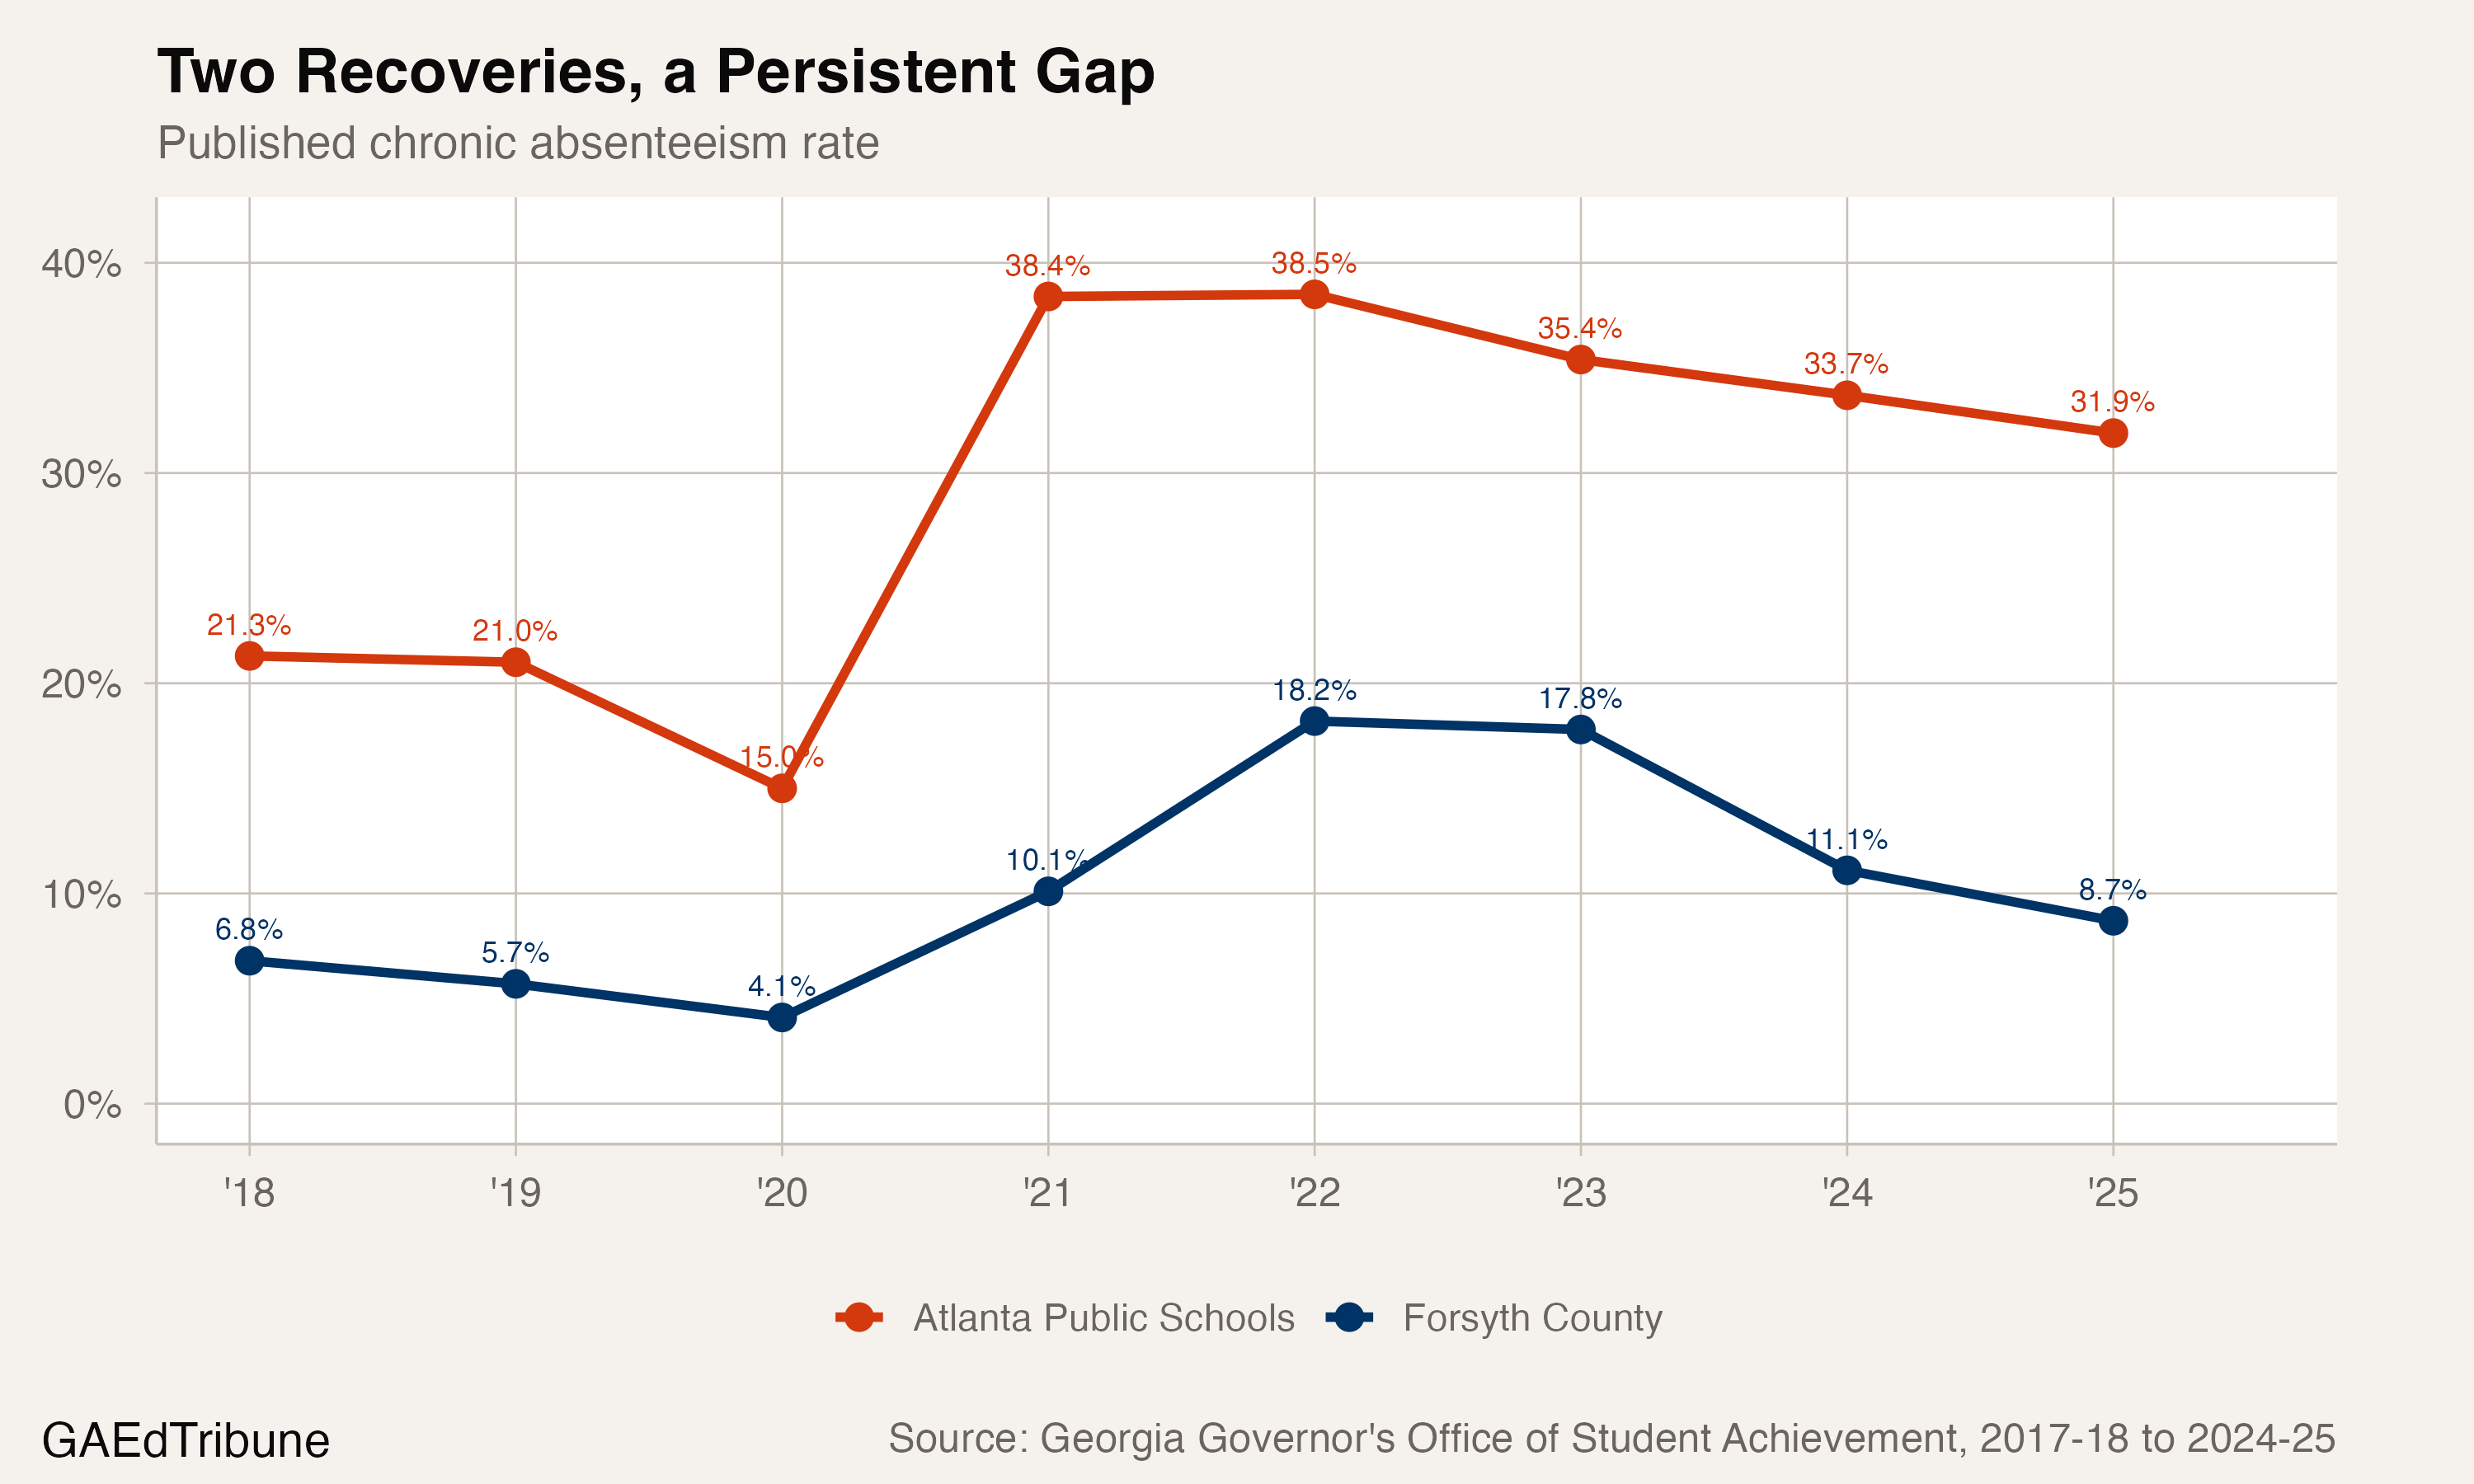
Forsyth County↗ET brought its published chronic absenteeism rate down to 8.7% in 2024-25. Atlanta Public Schools↗ET also improved, but its rate remained 31.9%. That left a 23.2-percentage-point gap between two large metro Atlanta school systems measured with the same state indicator.
The divide was already present in 2018-19, when the gap was 15.3 points. By 2024-25 it had widened by 7.9 points. The result is not a story of one district improving while the other stood still. Both improved for three consecutive annual transitions after reaching their highest rates in the available panel in 2021-22.
Recovery moved at different speeds
Forsyth's rate fell from 18.2% in 2021-22 to 8.7% in 2024-25, an improvement of 9.5 points. Atlanta moved from 38.5% to 31.9%, an improvement of 6.6 points. Each decline occurred across three adjacent year-to-year transitions, so the trend does not depend on skipping a reporting year.
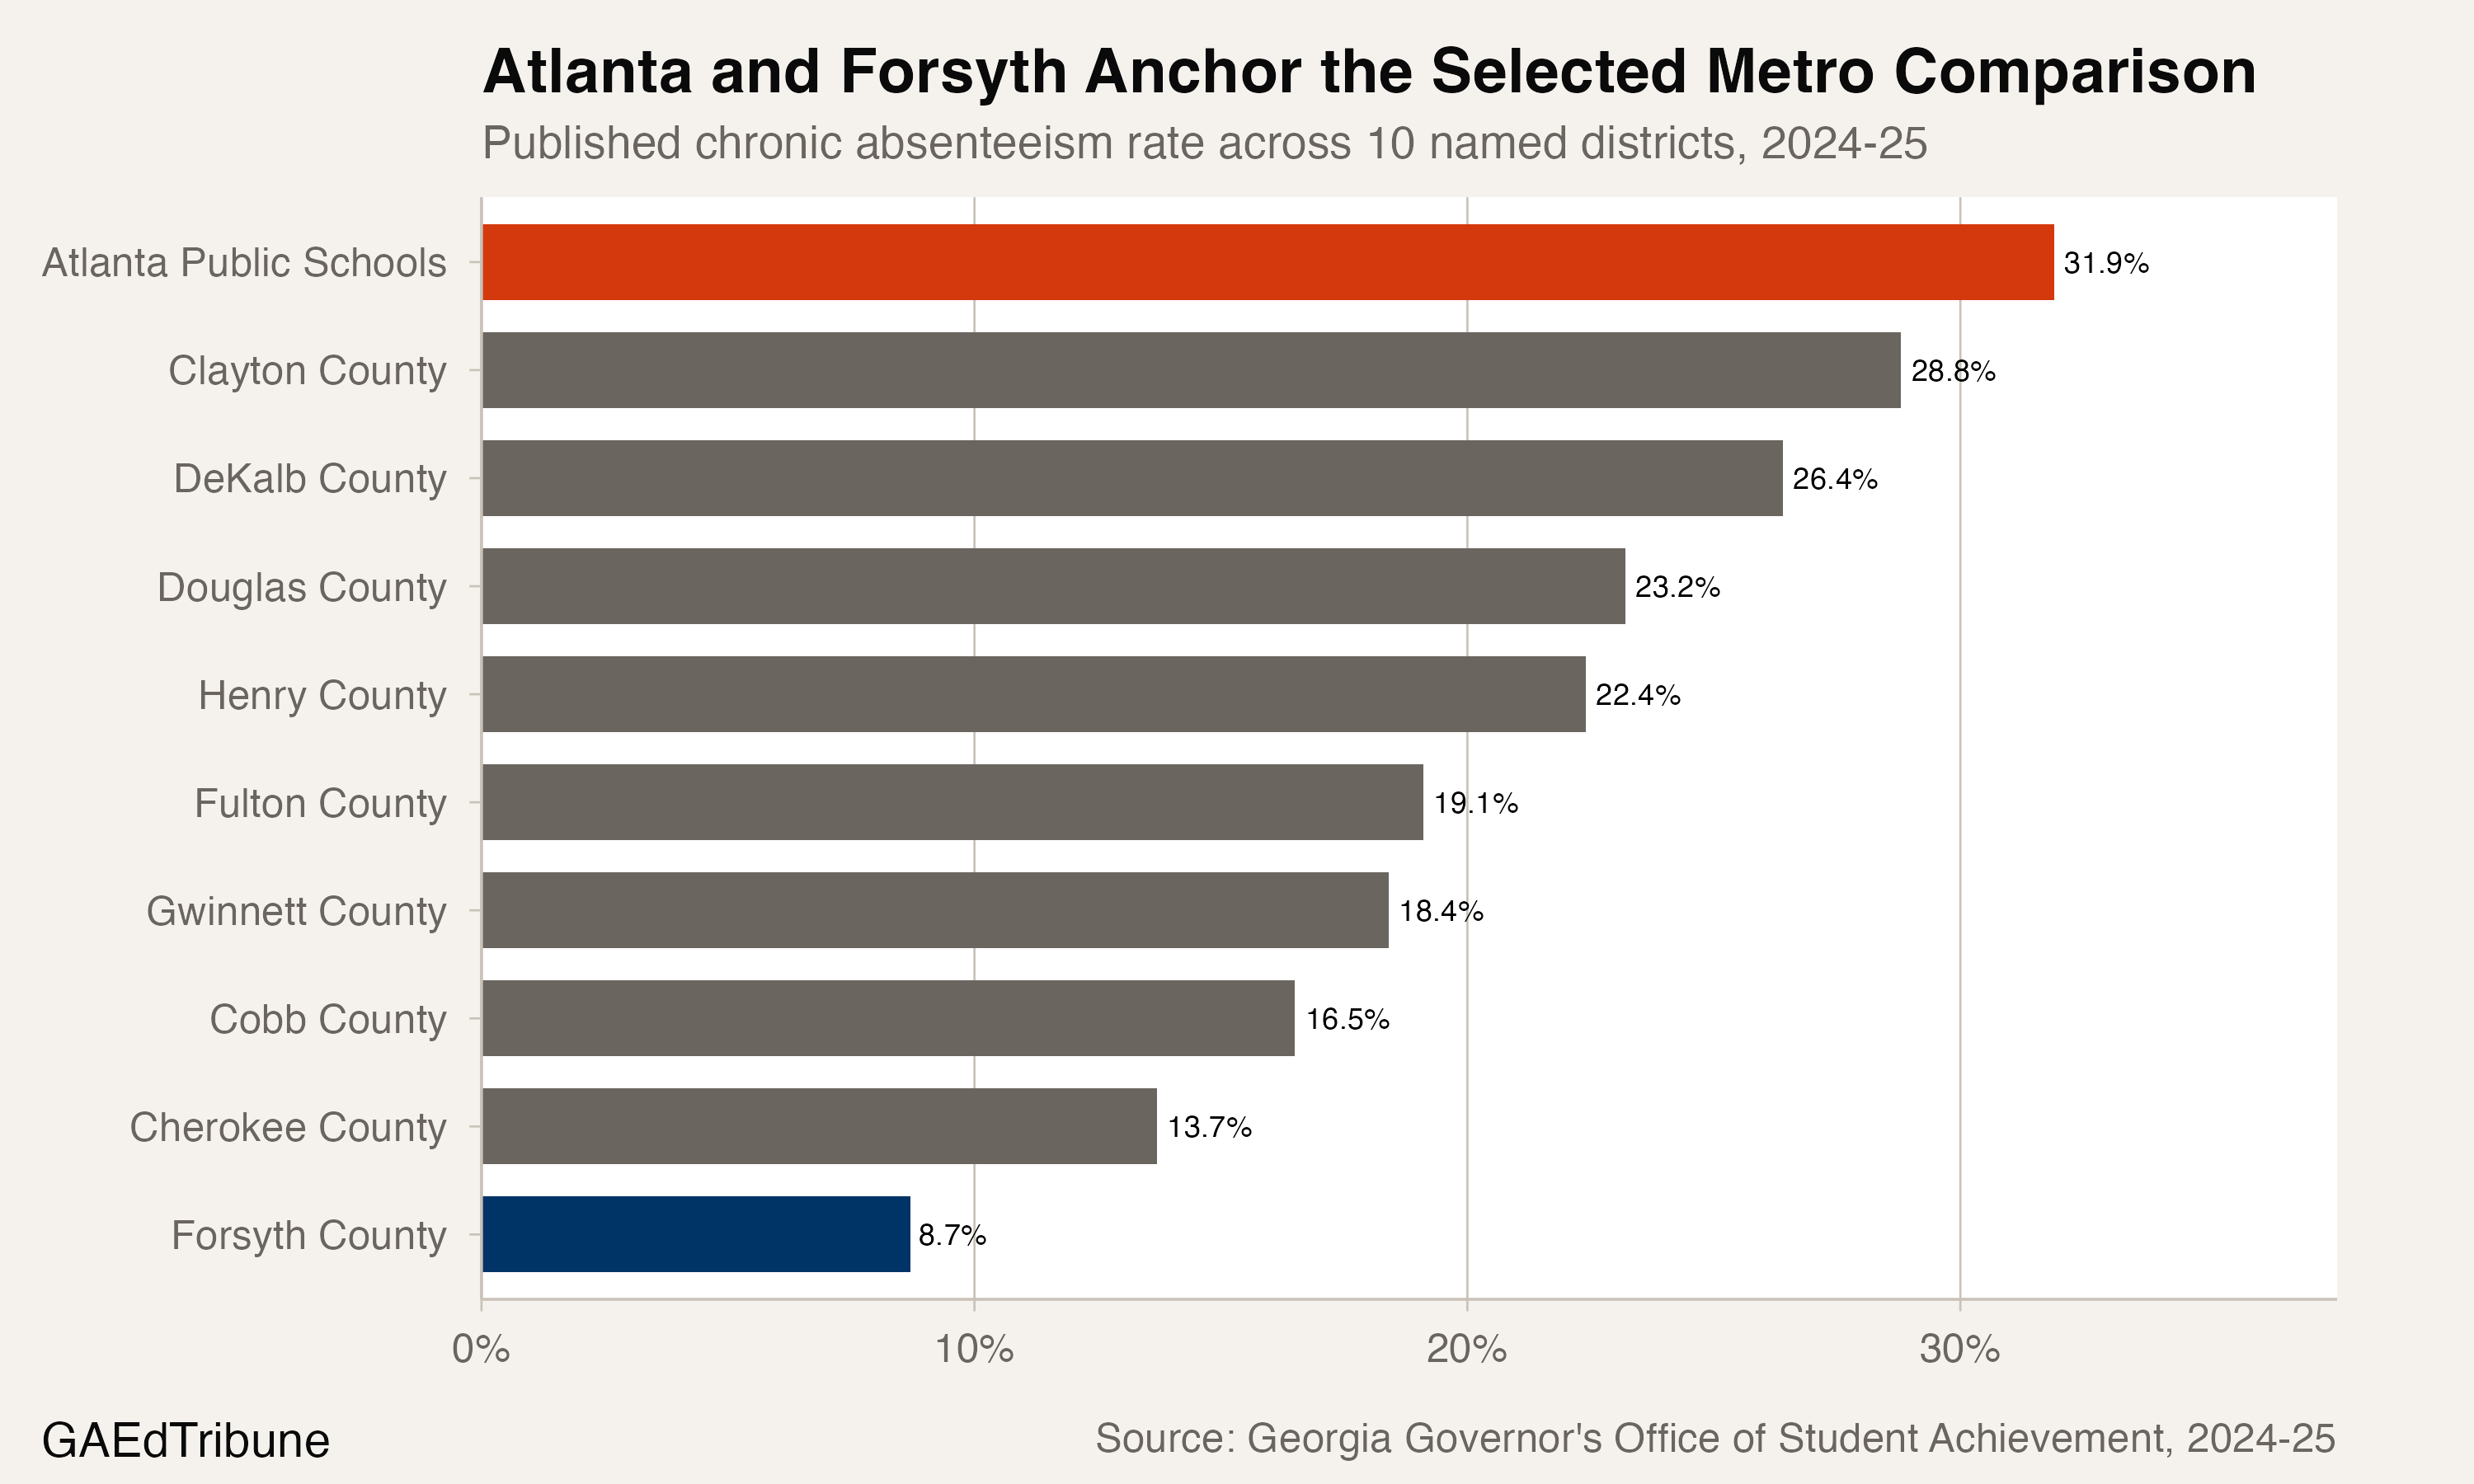
Georgia's statewide rate was 20.4% in 2024-25. Atlanta stood 11.5 points above it, while Forsyth stood 11.7 points below it. Among the ten named metro districts in the comparison below, Atlanta had the highest rate and Forsyth the lowest. That is a fixed descriptive comparison, not a claim about every possible definition of metro Atlanta.
Atlanta's internal gap remains wide
Atlanta's district average hides a much larger separation between reported student groups. In 2024-25, the published rate for Black students was 38.9%, compared with 6.6% for white students. The resulting 32.3-point gap was 11.5 points wider than the district's 20.8-point Black-white gap in 2018-19.
The full available panel matters here. The Black-white gap reached 42.3 points in 2020-21, then narrowed unevenly. It was 32.2 points in 2022-23, rose to 33.3 points in 2023-24, and fell to 32.3 points in 2024-25. Calling that path a steady recovery would erase the reversal in the middle.
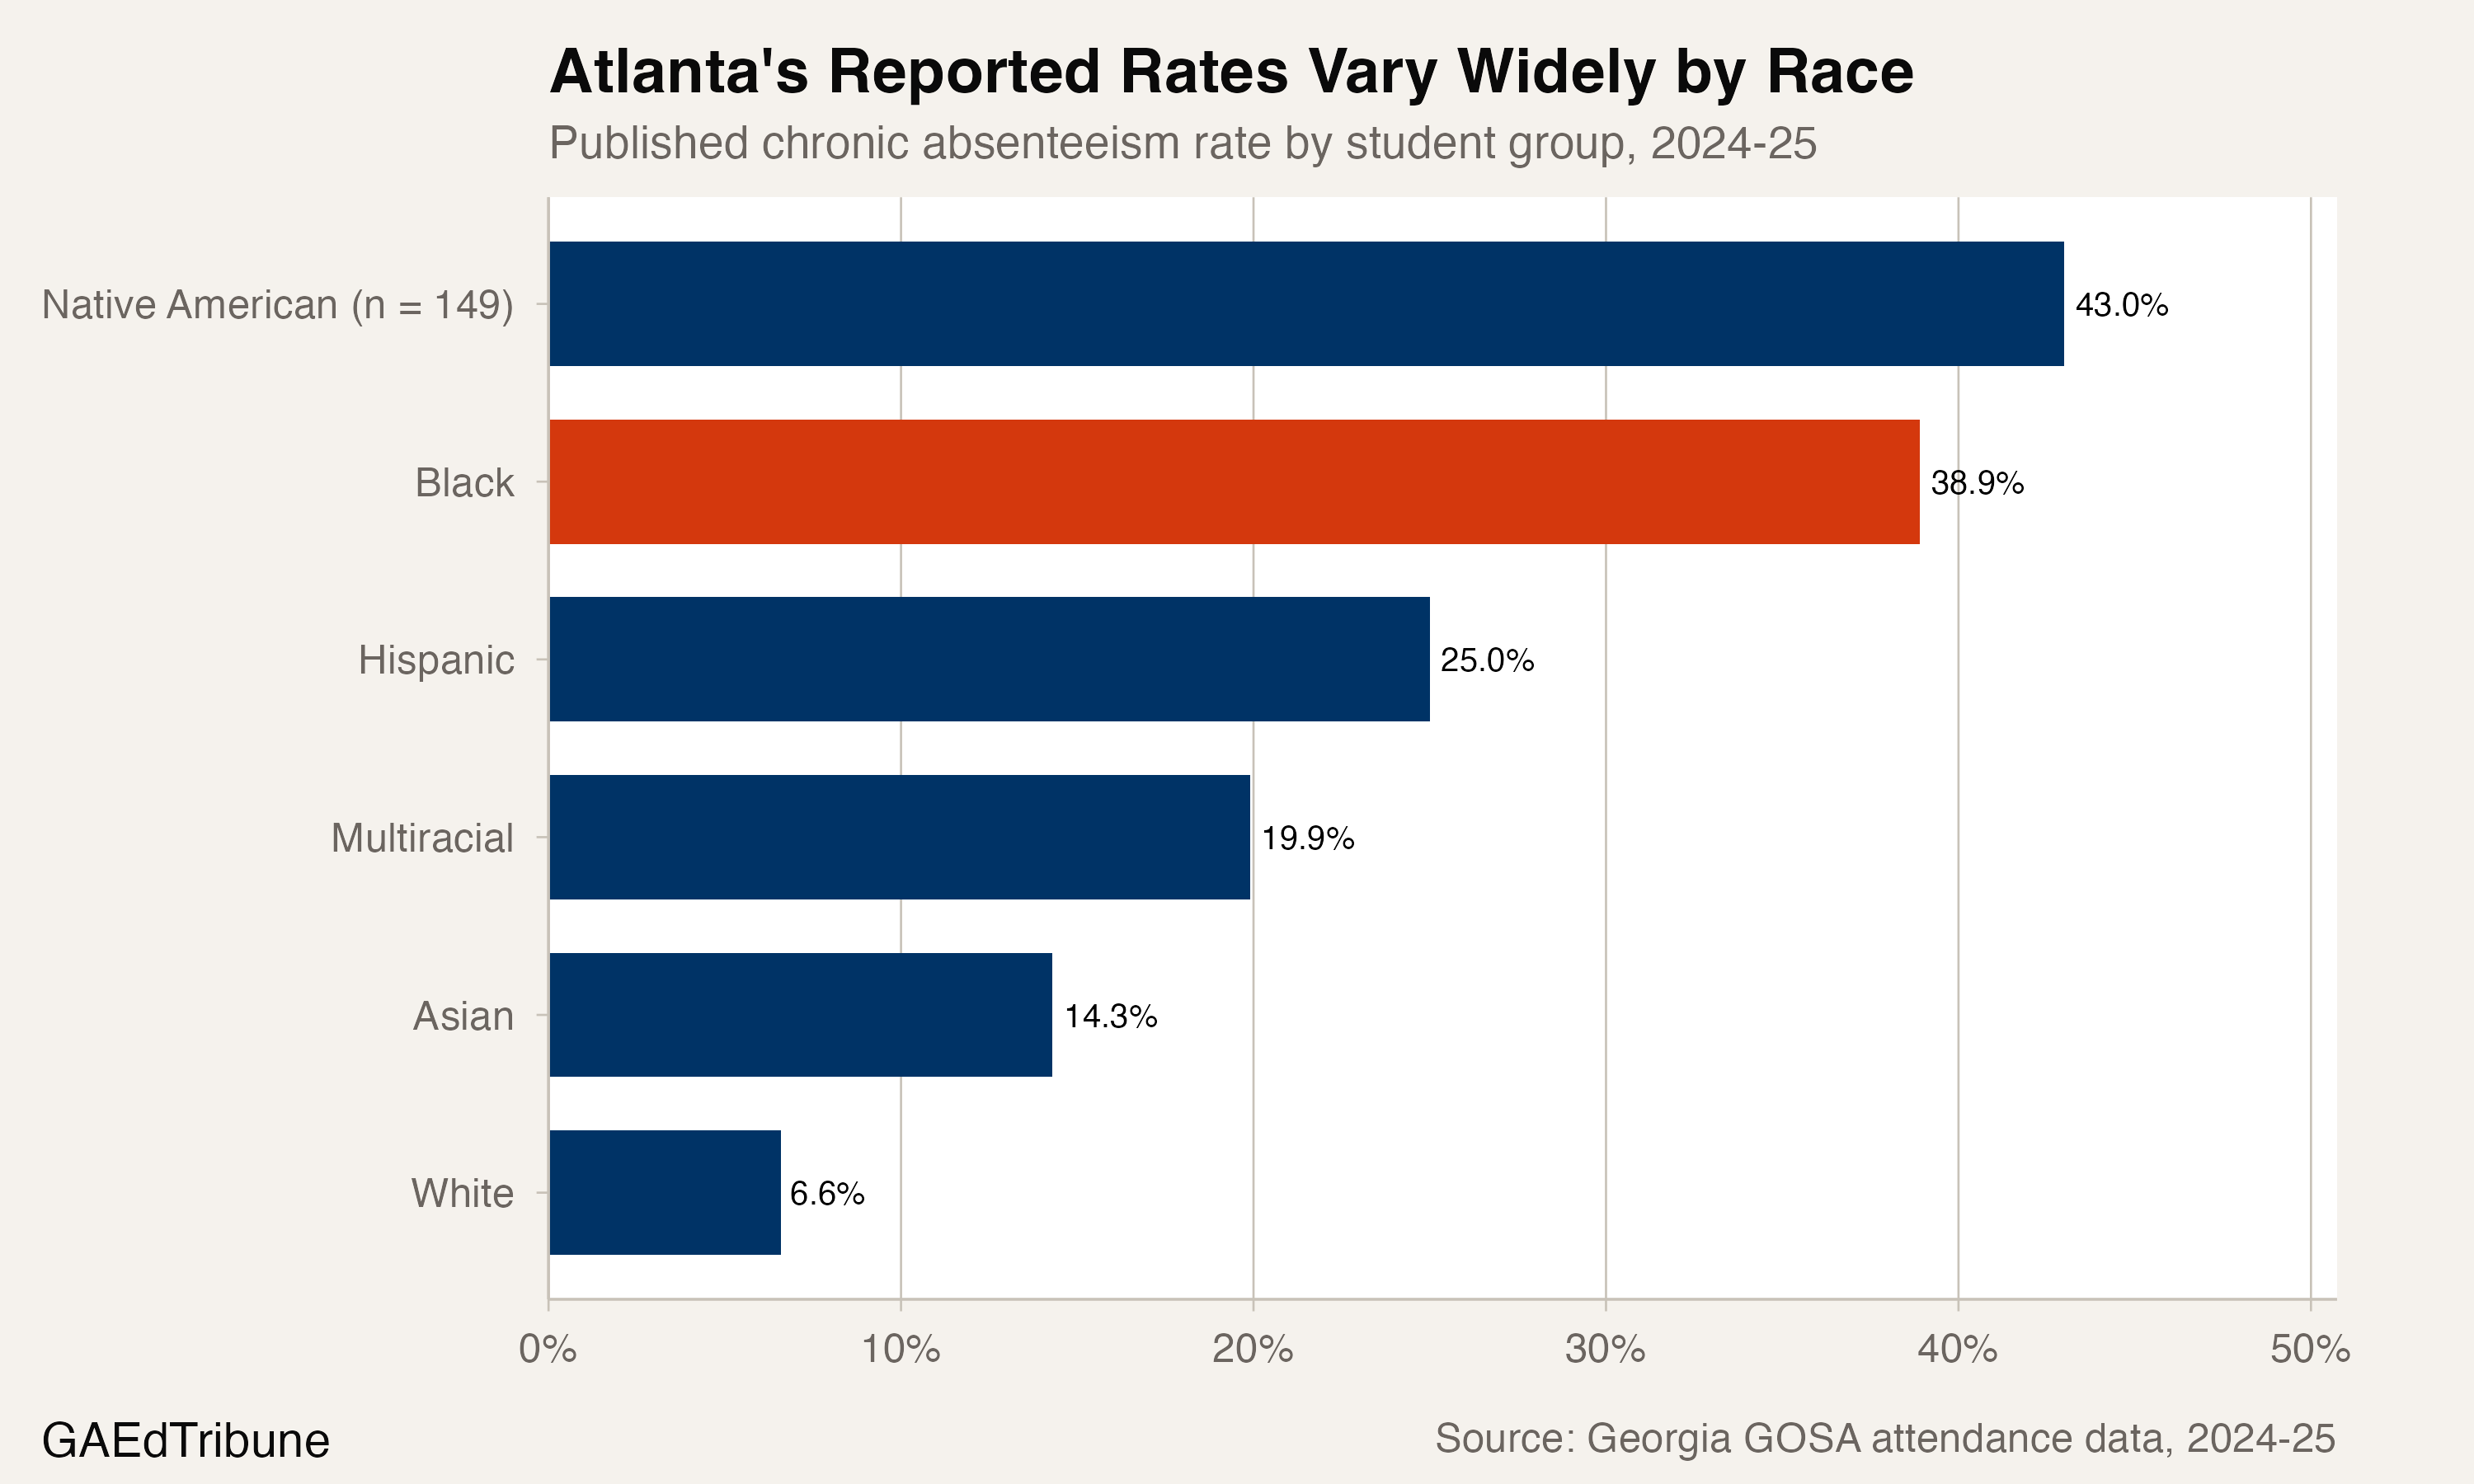
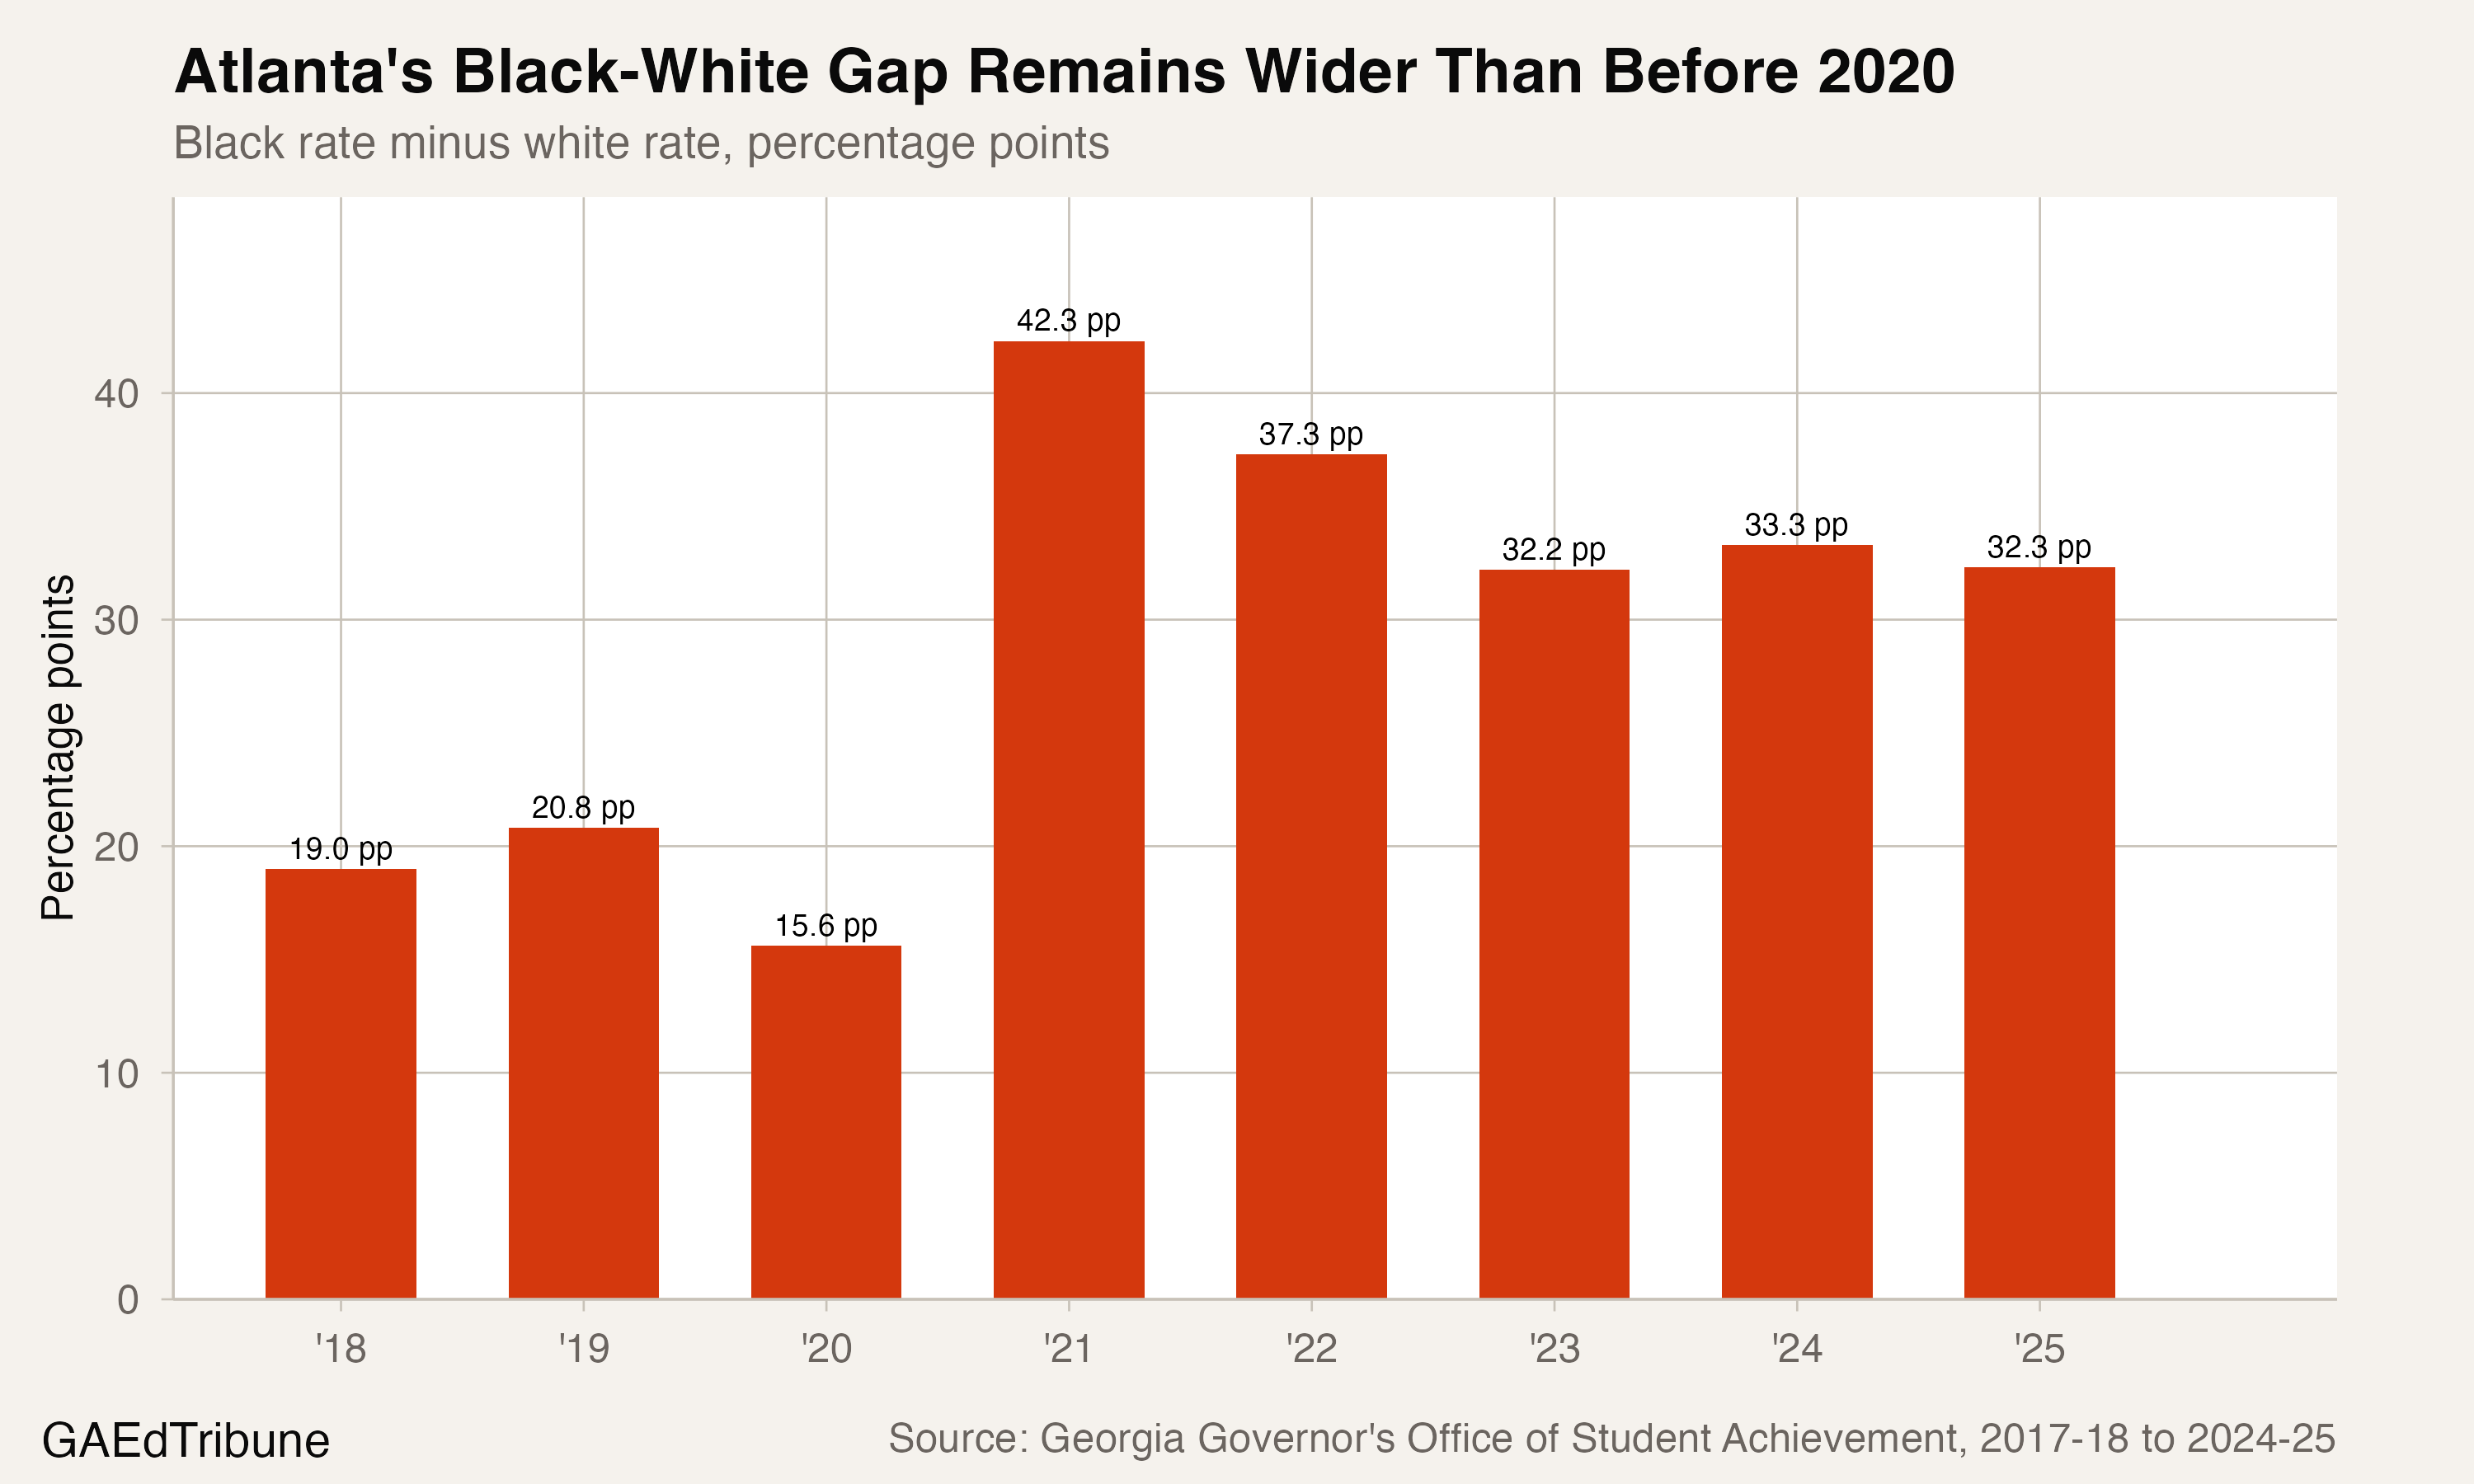
The race comparisons are descriptive. They do not identify why students missed school, and they do not control for differences among schools, neighborhoods, transportation, health, housing, or other barriers. The small published denominator for the Native American group also warrants particular caution when comparing its rate with larger groups.
The source labels matter
The state file reports free- or reduced-price lunch eligibility, not a general measure of economic disadvantage. Using the broader label would turn one administrative classification into a claim the source does not support.
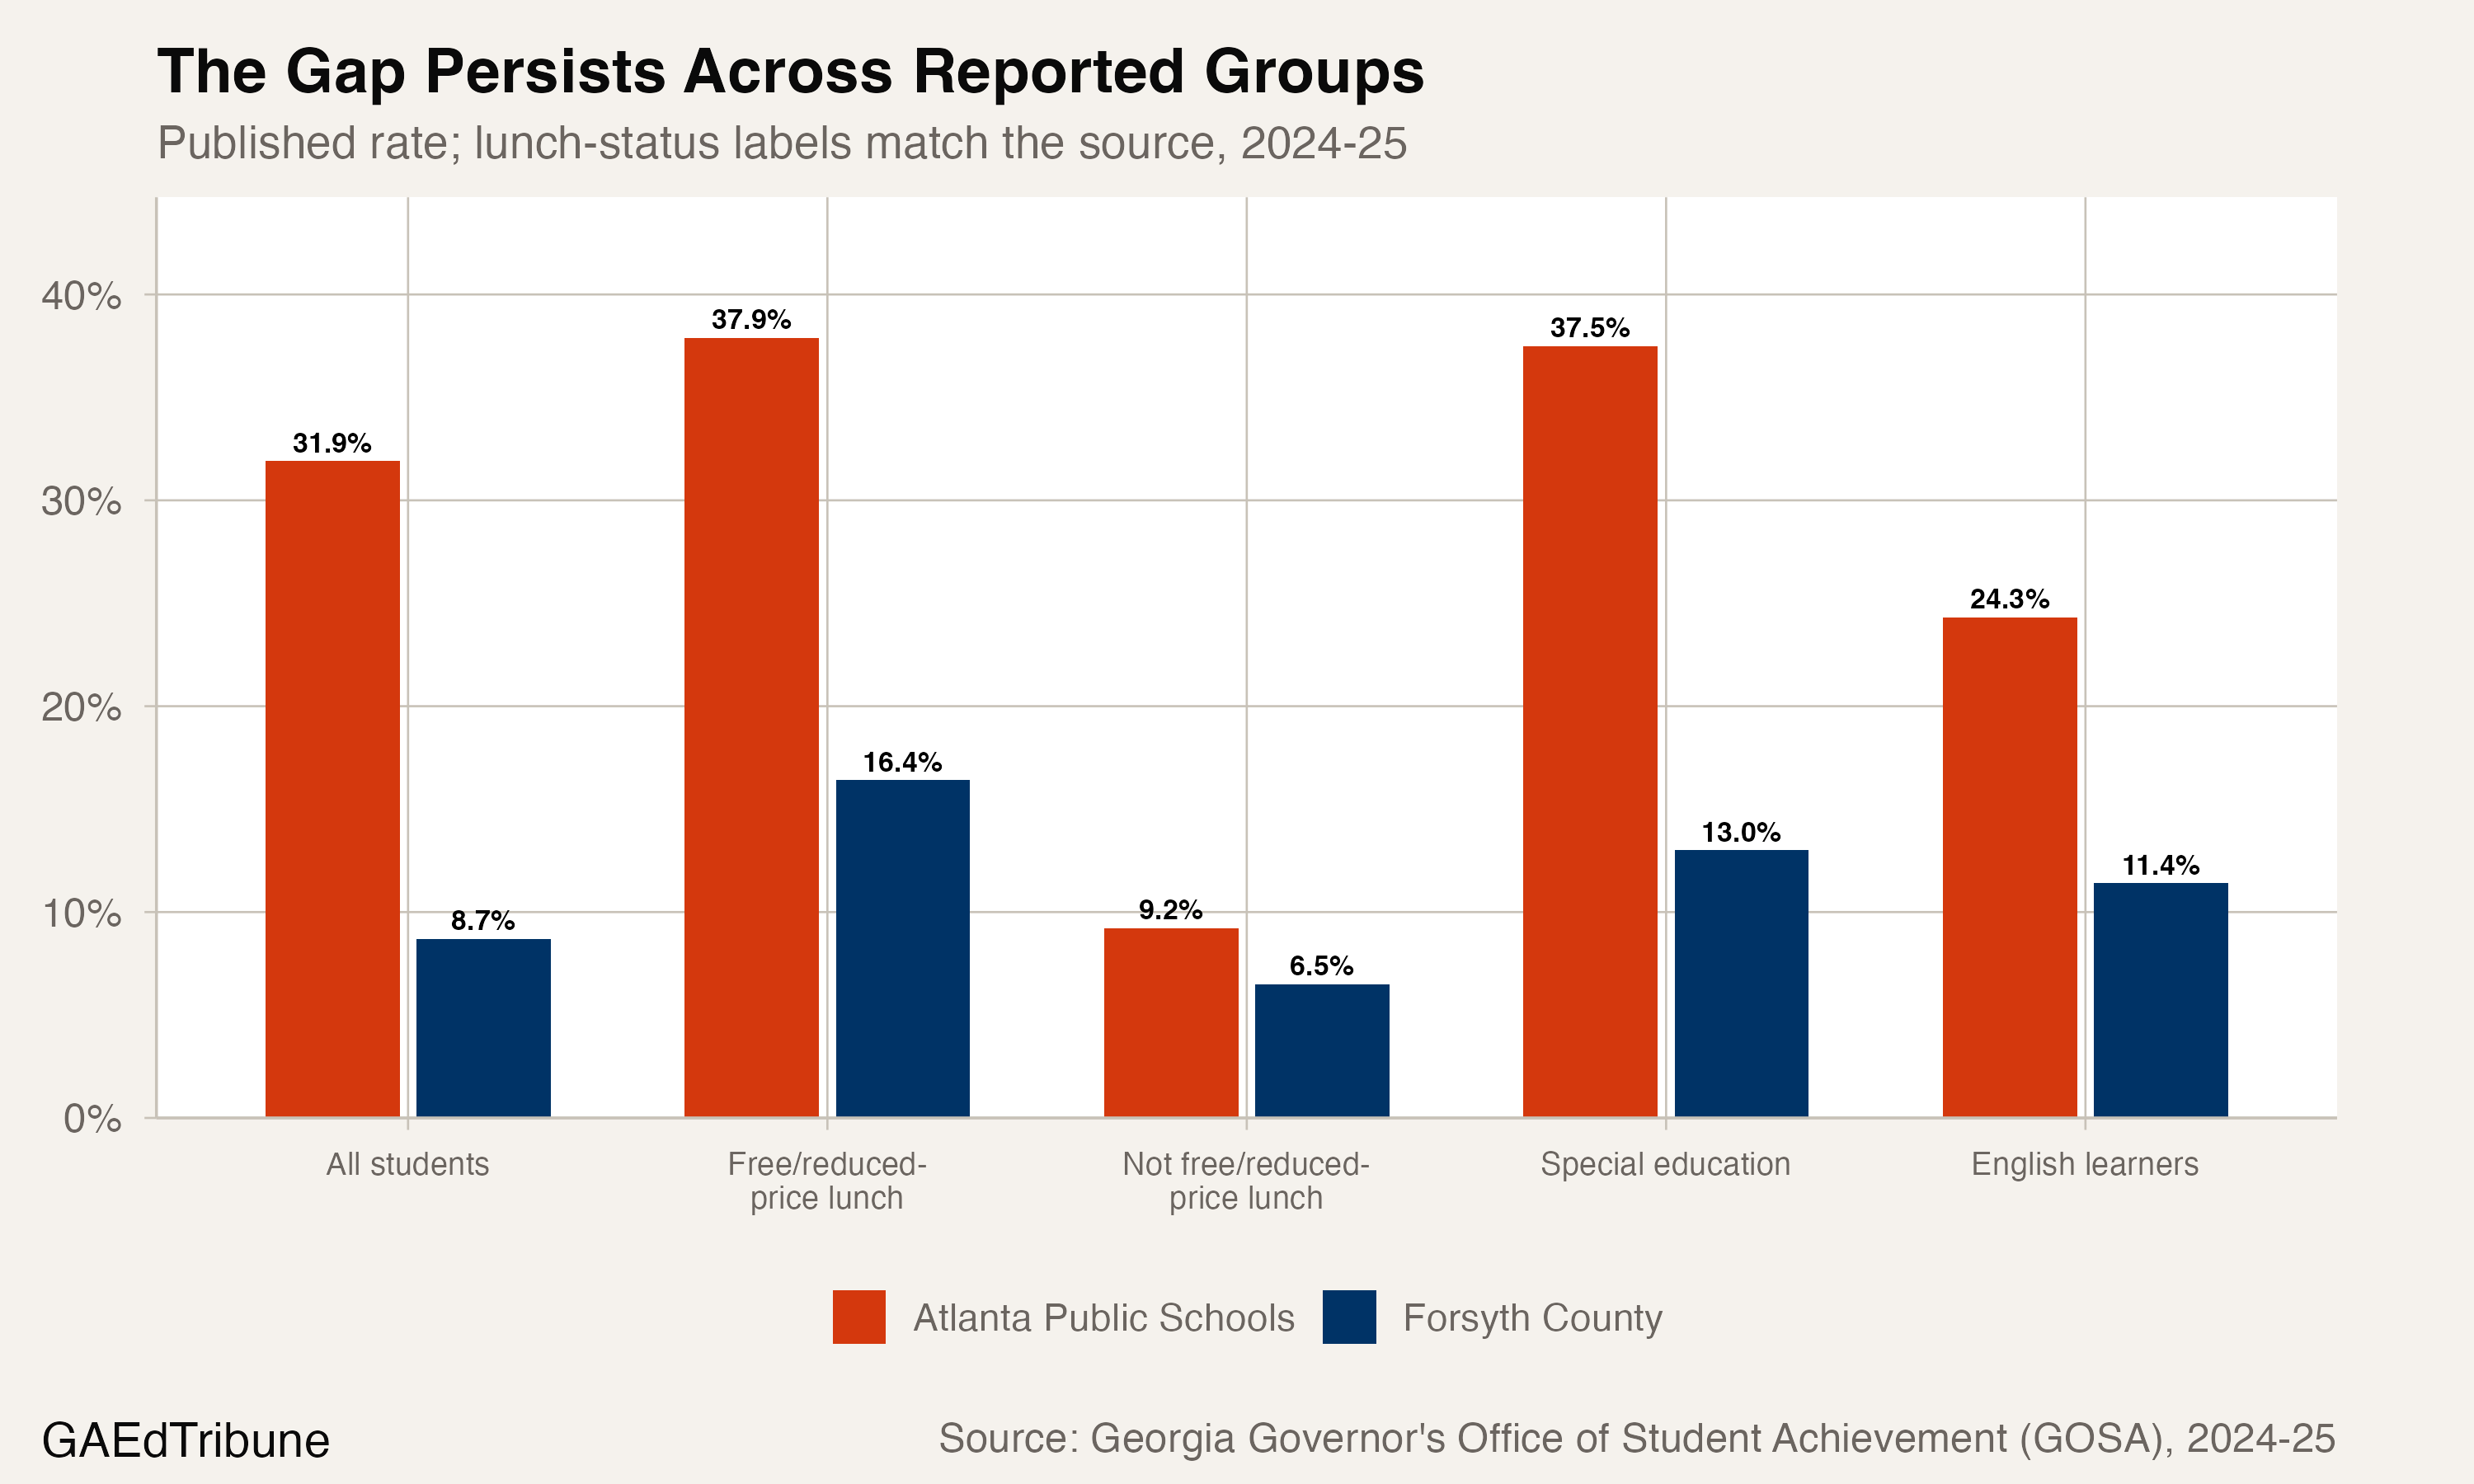
Among students qualifying for free or reduced-price lunch, Atlanta's chronic absence rate was 37.9% and Forsyth's was 16.4%, a 21.5-point gap. Among students not in that category, the rates were 9.2% and 6.5%, a 2.7-point gap. Those comparisons show that the district difference appears within both published lunch-status groups. They do not amount to a causal adjustment for family income.
The pattern also appears in other reported groups. Among students receiving special education services, the rates were 37.5% in Atlanta and 13.0% in Forsyth, a 24.5-point gap. Among English learners, the rates were 24.3% and 11.4%, a 12.9-point gap.
Different outcomes, visible support systems
Atlanta's attendance support page describes a tiered system that uses data review, family partnership, transportation and health supports, mental-health coordination, and home visits. Forsyth's school social work page describes an attendance protocol committee, social workers, and community resources.
Those district pages are direct evidence that the support structures exist. They are only suggestive context for interpreting the rates. The state attendance panel does not measure implementation intensity or estimate the effect of either district's approach, and it cannot establish that any one barrier caused the gap.
The attendance bands reinforce how differently the two systems were distributed in 2024-25. In Forsyth, 48.7% of students missed five or fewer days; in Atlanta, 31.5% did. At the other end, 29.3% of Atlanta students missed more than 15 days, compared with 10.3% in Forsyth. Atlanta's share in that band was about 2.8 times Forsyth's.
That last comparison is separate from the chronic absenteeism rate. Both fields come directly from the state file, but they answer different questions. One reports the state's chronic-absence indicator; the other places students into a published days-missed band.
The clearest question is not whether the two districts have attendance programs. Both say they do. It is which barriers are most common in each district, how consistently the supports reach students, and whether later state releases show the three-year improvement continuing without leaving the Atlanta-Forsyth gap intact.
Chronic absenteeism rates and attendance bands come from the Georgia Governor's Office of Student Achievement's downloadable attendance file.
Detailed code that reproduces the analysis and figures in this article is available exclusively to EdTribune subscribers.
Discussion
Sign in to join the discussion.
Loading comments...